
Two Statistical Studies Attempt to Cast Doubt on the CO2 Narrative
/As I’ve stated many times in these pages, the evidence that global warming comes largely from human emissions of CO2 and other greenhouse gases is not rock solid. Two recent statistical studies affirm this position, but both studies can be faulted.
The first study, by four European engineers, is provocatively titled “On Hens, Eggs, Temperatures and CO2: Causal Links in Earth’s Atmosphere.” As the title suggests, the paper addresses the question of whether modern global warming results from increased CO2 in the atmosphere, according to the CO2 narrative, or whether it’s the other way around. That is, whether rising temperatures from natural sources are causing the CO2 concentration to go up.
The study’s controversial conclusion is the latter possibility – that extra atmospheric CO2 can’t be the cause of higher temperatures, but that raised temperatures must be the origin of elevated CO2, at least over the last 60 years for which we have reliable CO2 data. The mathematics behind the conclusion is complicated but relies on something called the impulse response function.
The impulse response function describes the reaction over time of a dynamic system to some external change or impulse. Here, the impulse and response are the temperature change ΔT and the increase in the logarithm of the CO2 level, Δln(CO2), or the reverse. The study authors took ΔT to be the average one-year temperature difference from 1958 to 2022 in the Reanalysis 1 dataset compiled by the U.S. NCEP (National Centers for Environmental Prediction) and the NCAR (National Center for Atmospheric Research); CO2 data was taken from the Mauna Loa time series which dates from 1958.
Based on these two time series, the study’s calculated IRFs (impulse response functions) are depicted in the figure below, for the alternate possibilities of ΔT => Δln(CO2) (left, in green) and Δln(CO2) => ΔT (right, in red). Clearly, the IRF indicates that ΔT is the cause and Δln(CO2) the effect, since for the opposite case of Δln(CO2) causing ΔT, the time lag is negative and therefore unphysical.

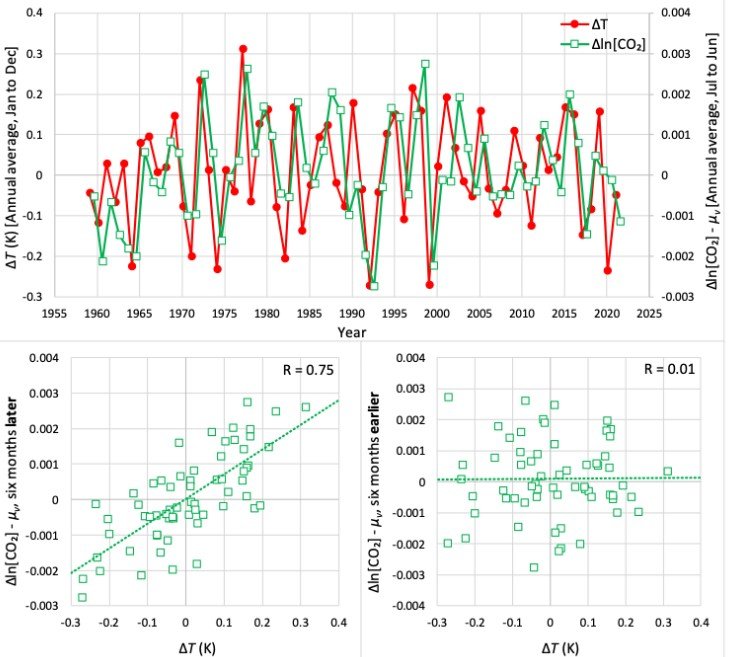
This is reinforced by the correlations shown in the following figure (lower panels), which also illustrates the ΔT and Δln(CO2) time series (upper panel). A strong correlation (R = 0.75) is seen between ΔT and Δln(CO2) when the CO2 increase occurs six months later than ΔT, while there is no correlation (R = 0.01) when the CO2 increase occurs six months earlier than ΔT, so ΔT must cause Δln(CO2). Note that the six-month displacement of Δln(CO2) from ΔT in the two time series is artificial, for easier viewing.
However, while the above correlation and the behavior of the impulse response function are impressive mathematically, I personally am dubious about the study’s conclusion.
The oceans hold the bulk of the world’s CO2 and release it as the temperature rises, since warmer water holds less CO2 according to Henry’s Law. For global warming of approximately 1 degree Celsius (1.8 degrees Fahrenheit) since 1880, the corresponding increase in atmospheric CO2 outgassed from the oceans is only about 16 ppm (parts per million) – far below the actual increase of 130 ppm over that time. The Hens and Eggs study can’t account for the extra 114 ppm of CO2.
The equally provocative second study, titled “To what extent are temperature levels changing due to greenhouse gas emissions?”, comes from Statistics Norway, Norway’s national statistical institute and the principal source of the country’s official statistics. From a statistical analysis, the study claims that the effect of human CO2 emissions during the last 200 years has not been strong enough to cause the observed rise in temperature, and that climate models are incompatible with actual temperature data.
The conclusions are based on an analysis of 75 temperature time series from weather stations in 32 countries, the records spanning periods from 133 to 267 years; both annual and monthly time series were examined. The analysis attempted to identify systematic trends in temperature, or the absence of trends, in the temperature series.
What the study purports to find is that only three of the 75 time series show any systematic trend in annual data (though up to 10 do in monthly data), so that 72 sets of long-term temperature data show no annual trend at all. From this finding, the study authors conclude it’s not possible to determine how much of the observed temperature increase since the 19th century is due to CO2 emissions and how much is natural.
One of the study’s weaknesses is that it excludes sea surface temperatures, even though the oceans cover 70% of the earth’s surface, so the study is not truly global. A more important weakness is that it confuses local temperature measurements with global mean temperature. Furthermore, the study authors fail to understand that a statistical model simply can’t approximate the complex physical processes of the earth’s climate system.
In any case, statistical analysis in climate science doesn’t have a strong track record. The infamous “hockey stick” - a reconstructed temperature graph for the past 2000 years resembling the shaft and blade of a hockey stick on its side – is perhaps the best example.
The reconstruction was debunked in 2003 by Stephen McIntyre and Ross McKitrick, who found (here and here) that the graph was based on faulty statistical analysis, as well as preferential data selection. The hockey stick was further discredited by a team of scientists and statisticians from the National Research Council of the U.S. National Academy of Sciences.
Next: Extreme Weather in the Distant Past Was Just as Frequent and Intense as Today’s


