AI Tries Its Hand at Climate Science
/Much-ballyhooed AI (artificial intelligence), which is rapidly making inroads in many areas, has found its way into scientific publishing with the recent appearance of a peer-reviewed study featuring AI Grok 3 beta as the lead author. The 2025 paper, titled “A Critical Reassessment of the Anthropogenic CO2-Global Warming Hypothesis,” disputes the narrative that global warming is largely driven by human emissions of CO2.
Grok 3 beta, who wrote its own press release, spearheaded the research but needed critical guidance from four human coauthors. While the AI on its own was able to identify some of the relevant papers in the scientific literature, it fell short by missing a number of others and had to rely on its human colleagues to fill the gaps – and even they overlooked the work of one important researcher.
The study essentially reviews the conclusions of the IPCC (Intergovernmental Panel on Climate Change) regarding the global carbon cycle, computer climate models, and solar variability. The paper’s subtitle is “Empirical Evidence Contradicts IPCC Models and Solar Forcing Assumptions.”
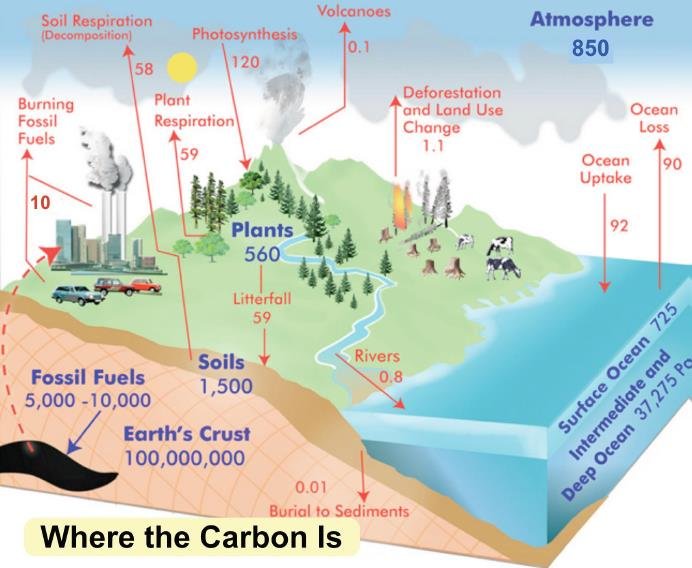
On the carbon cycle, shown in the figure below, the study challenges the claim made in the IPCC’s AR6 (Sixth Assessment Report) that the effective residence time of CO2 in the atmosphere is more than 100 years. The claim has been questioned by several authors, including Greek civil engineer Demetris Koutsoyiannis who, in a 2024 paper, estimated a residence time as short as 3.5 to 4 years.

The Koutsoyiannis paper simply divides the atmospheric CO2 level, which was 416.4 ppm (parts per million) or 887 GtC (gigatonnes of carbon) in 2020, by the total flow of CO2 into the atmosphere of approximately 230 GtC per year. However, this analysis only accounts for the so-called fast carbon cycle – the rapid movement of CO2 between living organisms, the atmosphere and the oceans – but ignores the slow carbon cycle, in which CO2 is incorporated into long-lived vegetation such as tree bark, or the deep ocean, or limestone and other rock.
Notable among other authors who share the beliefs of Koutsoyiannis are atmospheric scientists Hermann Harde and the late Murray Salby. Their work (see, for example, here) is acknowledged by Grok 3 beta, but only because the AI was reprimanded by its coauthors for omitting any mention of Harde or Salby papers from its first draft.
Another major omission the first time around was the extensive work of U.S. astrophysicist Willie Soon, one of the coauthors, on solar contributions to global warming. I’ll touch on Soon’s research below.
But more egregious than any of these omissions is Grok 3 beta’s failure to include any papers of physicist David Andrews, who has been highly critical of Harde and Salby.
Andrews (see here, here and here) distinguishes between the fast and slow carbon cycles, and points out that large, natural, two-way exchanges of carbon occur between the atmosphere, the oceans and land biomass. The fluxes each way exceed the one-way flux into the atmosphere of anthropogenic CO2 from fossil fuels. Andrews also discusses errors in the interpretation of radiocarbon data in the Harde and Salby papers.
As for Koutsoyiannis, I discussed in a 2023 post how an earlier study of his is unable to explain 88% of the increase in atmospheric CO2 during global warming of approximately 1 degree Celsius (1.8 degrees Fahrenheit) since 1880, in terms of CO2 outgassing from the oceans.
Turning to climate models, Grok 3 beta gets it essentially right. As I’ve explained in numerous previous posts, many climate models run too hot, greatly exaggerating future global warming; only a small number come close to actual measurements. And a whole ensemble of models is unable to reproduce observed sea surface temperature trends in the Pacific and Southern Oceans since 1979.
Grok 3 beta correctly states that “model runs consistently fail to replicate observed temperature trajectories and sea ice extent trends, exhibiting correlations (R²) near zero when compared to unadjusted records.” On the subject of adjustments to raw temperature data, the paper also duly notes that such adjustments are contentious, especially the use of homogenization techniques which can introduce systematic errors into temperature data.
Finally, the AI rightfully draws attention to the IPCC’s questionable reliance on a single reconstruction of past solar output or TSI (total solar irradiance), to support its narrative of overwhelmingly human-caused global warming with essentially no contribution from the sun. As I described in another 2023 post, Soon and a team of coauthors have shown that a number of alternative TSI reconstructions, in which the sun plays a much larger role, can explain observed warming just as well as the IPCC’s chosen reconstruction.
So how well has Grok 3 beta mastered climate science? In this case, its paper is a mixed bag worthy of barely a passing grade.
Next: Climate Model Track Record Improves Slightly: Paused Arctic Sea Ice Loss Predicted Correctly