
Ice Sheet Update (2): Greenland Ice Sheet Loss Slows Down
/Two big surprises have characterized recent warming-induced melting of the Antarctic and Greenland ice sheets. As I described in another post, the huge Antarctic ice sheet actually stopped melting – at least for now – and rebounded between 2021 and 2023, despite rising temperatures. And a new report highlights how the Greenland ice sheet in 2024 experienced its lowest annual ice loss since 2013.
Greenland’s ice sheet holds only about 10% as much ice as Antarctica’s. We hear more about it because the Greenland ice sheet is melting at a faster rate and contributes more to sea level rise. But the melt rate is no faster today than it was 90 years ago and appears to have slowed over the last few years.
The figure below shows the declining ice sheet mass from 2002 to 2024, based on NASA satellite data. In (a), the mass is shown relative to its value at the end of the spring/summer melt season in 2023, while (b) depicts the seasonal change in mass.
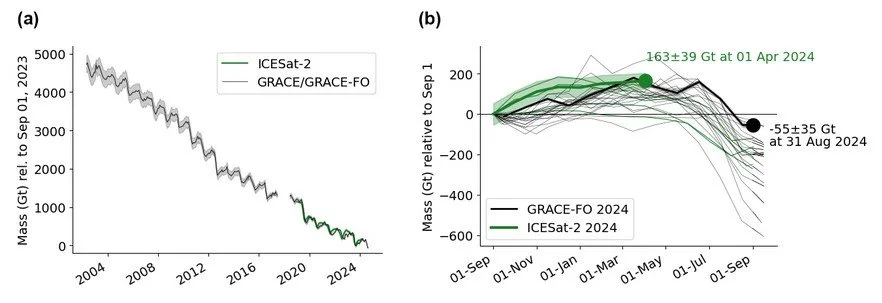
The average annual loss of ice between 2002 and 2023 was 266 gigatonnes (293 gigatons). As can be seen from the thick black line in (b), the 2023-24 loss was 55 gigatonnes (61 gigatons), the third lowest annual ice loss in the 23-year record; the thick green line is from a different satellite dataset. The report authors attribute the low ice loss in 2024 to above-average snowfall. Also apparent in (b) is that the Greenland ice sheet first increases in mass during winter months, due to snowfall, before losing mass over the warmer spring/summer months.
The extent of annual ice melting is illustrated in the next figure. Part (a) portrays the melt extent as a percentage of total ice sheet area for the 2023-24 melt season; part (b) shows the number of surface melt days from April 1 to August 31, 2024, expressed as an anomaly relative to the 1991-2020 mean.
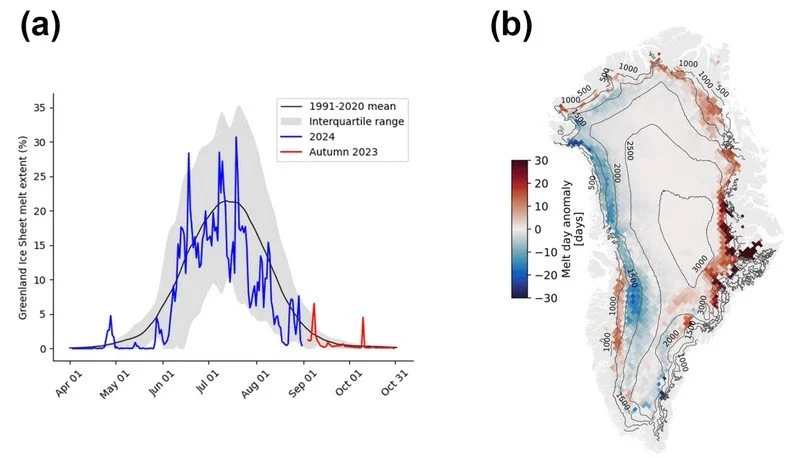
The melt pattern in (a) hovers around the mean melt percentage from 1991 to 2020, indicated by the black line. This result on its own means that losses from the ice sheet are not accelerating, as is sometimes claimed. And (b) reveals that, while Greenland as a whole was still losing ice in 2024, the losses occurred primarily on the east coast of the island, with some ice buildup on the west coast. The report authors attribute this to persistent summertime low pressure over southern Greenland in 2024.
In addition to spring/summer melting, the ice sheet loses ice at its edges from calving or breaking off of icebergs, and from submarine melting by warm seawater. The report authors have estimated the rate of Greenland ice sheet discharge, which typically peaks in July and reaches a minimum in the fall. The figure below shows the annual rate of solid ice discharge from 1991 to 2024 in (a), and the monthly rate in (b).

It can be seen that the discharge rate sped up in the early 2000s, but has since leveled off. The mean discharge rate from 1991 to 2020 was 458 gigatonnes (505 gigatons) per year. Although the solid ice discharge rate during 2023-24 (thick blue line in (b)) exceeded the long-term mean (thin black line), it was not the highest in the record.
The next figure shows the average annual gain or loss of both the surface mass balance (in blue) and the total ice sheet mass (in black), going all the way back to 1840. The surface mass balance includes gains from snowfall and losses from melt runoff, but not sheet edge losses from calving glaciers. Most of the data comes from meteorological stations across Greenland.

The total mass in this graph includes the surface mass balance, iceberg calving and submarine melting (combined in the gray dashed line), and melting from basal sources underneath the ice sheet, but not peripheral glaciers – glaciers that contribute 15 to 20% of Greenland’s total mass loss.
You can see that the rate of ice loss increased temporarily in the early 2000s, as noted previously. But it’s also clear from the graph that high short-term loss rates have occurred more than once in the past, notably in the 1930s and the 1950s – so the current shrinking of the Greenland ice sheet is nothing remarkable. There’s no obvious correlation with global temperatures, since the planet warmed from 1910 to 1940 but cooled from 1940 to 1970.
The Greenland ice sheet is currently the second largest contributor to sea level rise, after thermal expansion of ocean water due to warming. If the rate of ice loss were to remain at its 2002 to 2023 average of 266 gigatonnes (293 gigatons) per year, which is an annual loss of about 0.01% of the total mass of the ice sheet, it would take another 10,000 years for all Greenland’s ice to melt.
Next: A Novel Geoengineering Strategy to Combat Sea Level Rise (1)


