
New Evidence Confirms That Sea Level Rise Is Not Accelerating
/A blog post I wrote six years ago featured the lack of reliable scientific evidence at that time for any acceleration in the rate of average global sea level rise. Although several research reports since then claim to have found evidence that the rate of rise is accelerating, a new study puts the kibosh on that notion – and finds that the current rate of rise is less than half what is commonly accepted by climate scientists.
The study, by an engineer and researcher duo in The Netherlands, compiled sea level rise data from local observations worldwide, but mostly in the Northern Hemisphere, between approximately 1960 and 2020. The observations come from tide gauge records, which provide a more complete dataset than satellite altimetry that dates from only 1993.
It’s tide gauge measurements that matter to the local community and its engineers and planners. Tide gauges measure the height of the sea relative to the land to which the gauge is attached, the so-called RSL (Relative Sea Level) metric. Satellite observations of absolute sea level measure the height of the sea, which is the distance of its surface to the center of the earth. Land subsidence artificially amplifies any local RSL rise and makes satellite-measured sea levels higher than tide gauge RSLs.
The Dutch study used two datasets. The first, known as the PSMSL (Permanent Service for Mean Sea Level) provides historic records of monthly and yearly sea levels. The second dataset, called the GLOSS (Global Sea Level Observing System) provides hourly data; yearly mean sea levels are derived from the hourly data via so-called tidal analysis, which takes multi-year tidal forces into account. All data were downloaded in 2023, and only full years were utilized.
The PSMSL network consists of 1,533 locations for which data are recorded. Of these, only 204 locations met the study’s selection criteria of data being available over a period of at least 60 years, and for at least 80% of that period. The results are presented in the figure below. The rate of sea level rise is indicated by the color of the circles and triangles; triangles designate statistically significant acceleration of sea level rise, while circles designate non-significant acceleration. Statistical significance was determined by what is known as the F-test.
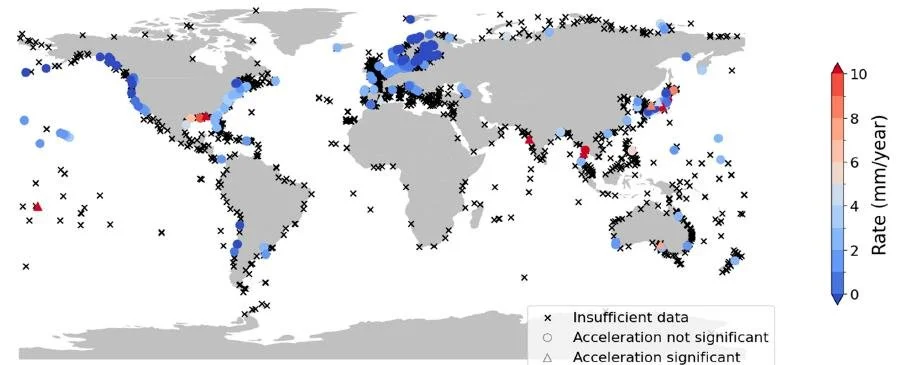
The acceleration is statistically significant in just 9 locations, or 4% of the total 204. Several of these locations form a cluster in Japan, while the remainder are solitary sites in Spain, Thailand, India, Australia and the Pacific. The meager amount of usable data in the Southern hemisphere is clearly visible.
Of the locations without significant acceleration, high rates of rise (up to 10 mm per year) are found in one location in the Pacific, in the US along the Gulf Coast, on the west coast of India, and in Japan, Thailand and Australia. Negative rates of rise, caused by rebound after melting of the last ice age’s heavy ice sheet, are found in the Baltic and along the west coast of Canada.
Similar but more limited results were obtained from the GLOSS network. Only 39 locations met the study’s selection criteria, and statistically significant acceleration is detected in a mere 3 of these. The highest rates of rise are found in the Pacific and Latin America, in this case coinciding with the locations showing acceleration.
Both datasets, nevertheless, yield a mean rate of sea level rise in 2020 considerably lower than NASA’s estimated 2020 rate of about 3.3 mm per year. For the more extensive PSMSL network, the 2020 median rate of sea level rise is found to be 1.5 mm per year as seen in the next figure, while the median rate for the GLOSS network is 1.9 mm per year.

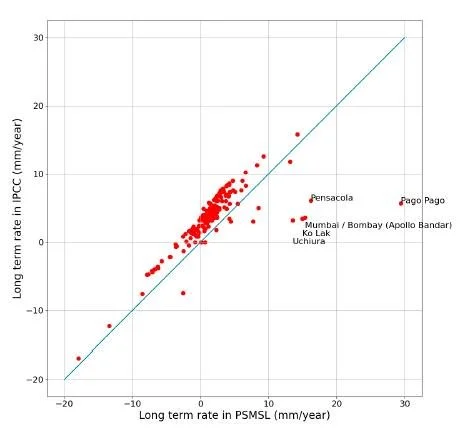
The same overestimation of sea level rise rates can be found in reports of the UN’s IPCC (Intergovernmental Panel on Climate Change). In the figure below that compares the rise rates calculated in the Dutch study, from PSMSL data, with those in the IPCC Sixth Assessment Report, it can be seen that the IPCC’s median rate (blue line) is too high by about 2 mm per year compared with most of the actual observations.
For both datasets, approximately 95% of the locations studied show no statistically significant acceleration of sea level rise. The study authors conclude that the accelerated sea level rise observed at the remaining 5% of locations can be explained by local, nonclimatic phenomena such as land subsidence or, in a few cases, plate tectonics. They say that the observed behavior is inconsistent with sea level acceleration driven by climate change.
Land subsidence arises predominantly from groundwater extraction, but also from mineral mining, rapid urban development that leads to compaction due to construction, and loading by river sediments.
Next: Sea Ice Not Currently Shrinking at Either Pole


