A New Threat to Science: AI Making Up References in Research Papers
/It’s not a new phenomenon. AI has been “hallucinating” – making things up – for some time, in areas ranging from law to medicine. But a new example of this affliction has recently emerged: fabricating citations in scientific research papers.
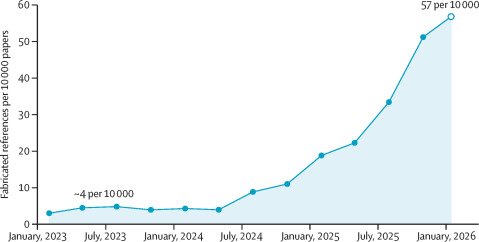
A recent article in the prestigious medical journal The Lancet reported the first systematic evaluation of reference authenticity. The audit of 2.5 million biomedical papers spanning 3 years showed that fabricated references are deeply embedded in the peer-reviewed literature. And the rate of fabrication is accelerating, as demonstrated in the figure below.
The integrity of references is fundamental to the integrity of scientific literature. Each reference implicitly asserts that a verifiable source exists and bolsters the claims being made. When references cite non-existent studies, readers, reviewers and policy makers are unable to evaluate the evidence.
Fabricated references can arise from paper mill activity and intentional deception, as well as the indiscriminate use of AI writing tools. Large language models (LLMs) are capable of generating plausible sounding but fictitious references. Previous studies have estimated that between 30% and 69% of LLM-generated references in biomedical research are fabricated, say The Lancet authors. The references are often correctly formatted, attributed to real researchers and include credible publication dates, making them difficult to detect by conventional peer review.
The authors developed an automated reference verification system by scanning PubMed Central’s Open Access subset from January 1, 2023, to February 18, 2026. That effort examined 2,471,758 papers and 125,615,773 structured references. Of the 125.6 million references, 77% carried a PubMed identifier and were verified; the remaining 23%, predominantly non-indexed references (from sources such as websites and books), were excluded.
Among the verified references, which came from 2810 papers, the authors identified 4046 fabricated citations. In 2023, approximately one in 2828 papers contained at least one fabricated reference. By 2025, this had gone up to one in 458, and in the first 7 weeks of 2026, a staggering one in 277 papers had at least one fabricated reference. As shown in the figure above, the fabrication rate increased by more than 10 times from 2023 to 2026.
It was found that 91% of affected papers contained just one or two fictitious references; 9% contained three or more. The sharp inflection in mid-2024 coincides with the expected publication lag following widespread LLM adoption, although increased paper mill activity and changes in journal indexing practices might also have contributed. LLMs became widely available in late 2022 and 2023.
The article’s authors qualify their findings by stating that the exclusion of 23% of references with no PubMed identifier could bias their estimates. Furthermore, PubMed Central’s Open Access does not cover all biomedical literature, and the early 2026 data span only 7 weeks. And, they say, their approach identifies the problem but not the underlying cause.
Nonetheless, the authors do have some recommendations for publishers. These include integrating automated reference verification into submission workflows before peer review; having indexing services add integrity metadata to article records so that users can assess the reliability of references; and retroactively screening existing publications and issuing corrections or retractions when fabricated references compromise a paper’s conclusions.
On the broader question of why such fabrication is occurring, the answer lies in the training of LLMs. A 2025 article in Science magazine argues that AIs hallucinate because they’re trained to fake answers when they don’t know how to answer a question. A team from OpenAI and the Georgia Institute of Technology is more specific:
They learn to bluff because their performance is ranked using standardized benchmarks that reward confident guesses and penalize honest uncertainty.
Although AIs could be modified to admit that “I don’t know,” this could simply turn off users, who would then seek an alternative LLM. A better solution, say several computer scientists, would be to rework benchmarks to penalize an AI for guessing incorrectly. Current benchmarks don’t penalize incorrect guesses any more than nonanswers.
The need for AI to clean up its act is especially important in medicine. In deciding on patient treatment, medical professionals are often influenced by clinical guidelines in the research literature. Doctors and practitioners have no way of knowing whether the evidence they are relying on actually exists.
In a comment accompanying The Lancet article, two pediatrics professors place the onus on manuscript authors themselves, saying that:
Authors must take responsibility and be held accountable for the entire content of a manuscript, including the references.
The professors believe that a published manuscript in which a fabricated reference is detected should be retracted. While this may seem harsh, such a move would go a long way toward meeting the AI challenge and restoring the integrity of scientific research.
Next: RIP RCP8.5: A Hopeful Sign That the Attack on Science Is Letting Up