
Exactly How Large Is the Urban Heat Island Effect in Global Warming?
/It’s well known that global surface temperatures are biased upward by the urban heat island (UHI) effect. But there’s widespread disagreement among climate scientists about the magnitude of the effect, which arises from the warmth generated by urban surroundings, such as buildings, concrete and asphalt.
In its Sixth Assessment Report in 2021, the IPCC (Intergovernmental Panel on Climate Change) acknowledged the existence of the UHI effect and the consequent decrease in the number of cold nights since around 1950. Nevertheless, the IPCC is ambivalent about the actual size of the effect. On the one hand, the report dismisses its significance by declaring it “less than 10%” (Chapter 2, p. 324) or “negligible” (chapter 10, p. 1368).
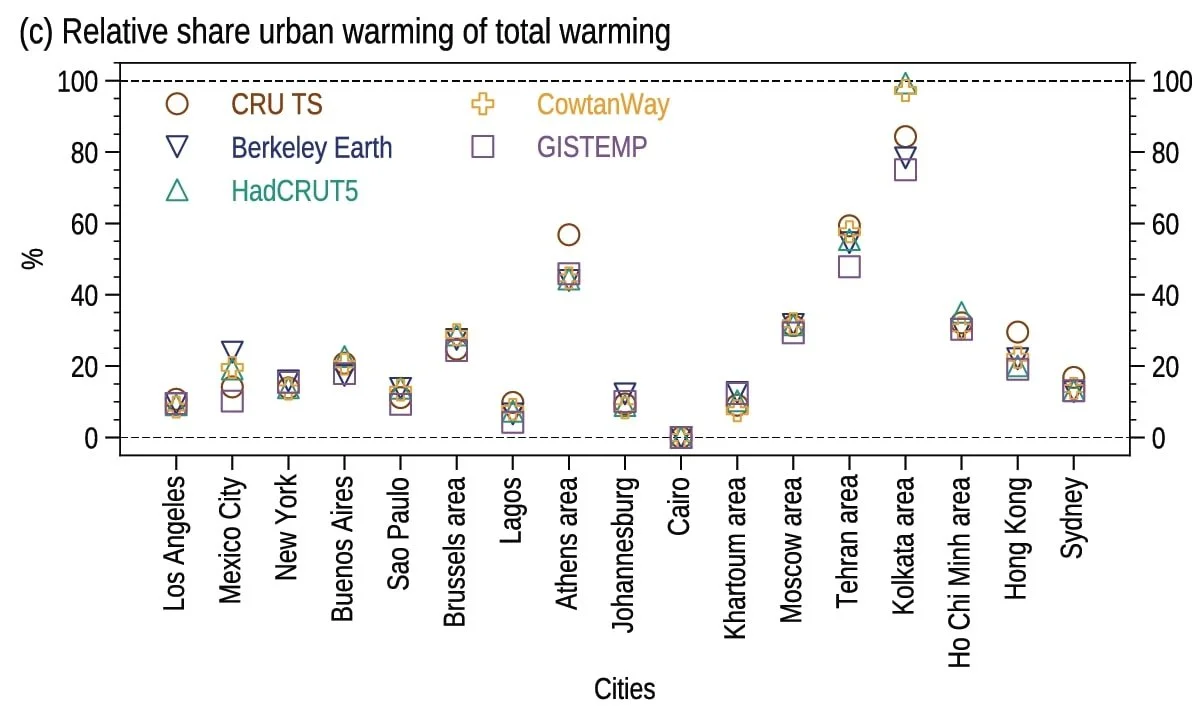
On the other hand, the IPCC presents a graph (Chapter 10, p. 1455), reproduced below, showing that the UHI effect ranges from 0% to 60% or more of measured warming in various cities. Since the population of the included cities is a few per cent of the global population, and many sizable cities are not included, it’s hard to see how the IPCC can state that the global UHI effect is negligible.
One climate scientist who has studied the magnitude of the UHI effect for some time is PhD meteorologist Roy Spencer. In a recent preview of a paper submitted for publication, Spencer finds that summer warming in U.S. cities from 1895 to 2023 has been exaggerated by 100% or more from UHI warming. The next figure shows the results of his calculations which, as you would expect, depend on population density.

The barely visible solid brown line is the measured average summertime temperature for the continental U.S. (CONUS) relative to its 1901-2000 average, in degrees Celsius, from 1895 to 2023; the solid black line represents the same data corrected for UHI warming, as estimated from population density data. The measurements are taken from the monthly GHCN (Global Historical Climatology Network) “homogenized” dataset, as compiled by NOAA (the U.S. National Oceanic and Atmospheric Administration).
You can see that the UHI effect accounts for a substantial portion of the recorded temperature in all years. Spencer says that the UHI influence is 24% of the trend averaged over all measurement stations, which are dominated by rural sites not subject to UHI warming. But for the typical “suburban” station (100-1,000 persons per square km), the UHI effect is 52% of the measured trend, which means that measured warming in U.S. cities is at least double the actual warming.
Globally, a rough estimate of the UHI effect can be made from NOAA satellite temperature data compiled by Spencer and Alabama state climatologist John Christy. Satellite data are not influenced by UHI warming because they measure the earth’s near-surface, not surface, temperature. The most recent data for the global average lower tropospheric temperature are displayed below.

According to Spencer and Christy’s calculations, the linear rate of global warming since measurements began in January 1979 is 0.15 degrees Celsius (0.27 degrees Fahrenheit) per decade, while the warming rate measured over land only is 0.20 degrees Celsius (0.36 degrees Fahrenheit) per decade. The difference of 0.05 degrees Celsius (0.09 degrees Fahrenheit) per decade in the warming rates can reasonably be attributed, at least in part, to the UHI effect.
So the UHI influence is as high as 0.05/0.20 or 25% of the measured temperature trend – in close agreement with Spencer’s 24% estimated from his more detailed calculations.
Other estimates peg the UHI effect as larger yet. As part of a study of natural contributions to global warming, which I discussed in a recent post, the CERES research group suggested that urban warming might account for up to 40% of warming since 1850.
But the 40% estimate comes from a comparison of the warming rate for rural temperature stations alone with that for rural and urban stations combined, from 1900 to 2018. Over the shorter time period from 1972 to 2018, which almost matches Spencer and Christy’s satellite record, the estimated UHI effect is a much smaller 6%. The study authors caution that more research is needed to estimate the UHI magnitude more accurately.
The effect of urbanization on global temperatures is an active research field. Among other recent studies is a 2021 paper by Chinese researchers, who used a novel approach involving machine learning to quantify the phenomenon. Their study encompassed measurement stations in four geographic areas – Australia, East Asia, Europe and North America – and found that the magnitude of UHI warming from 1951 to 2018 was 13% globally, and 15% in East Asia where rapid urbanization has occurred.
What all these studies mean for climate science is that global warming is probably about 20% lower than most people think. That is, about 0.8 degrees Celsius (1.4 degrees Fahrenheit) at the end of 2022, before the current El Niño spike, instead of the reported 0.99 degrees Celsius (1.8 degrees Fahrenheit). Which means in turn that we’re only halfway to the Paris Agreement’s lower limit of 1.5 degrees Celsius (2.7 degrees Fahrenheit).
Next: Sea Ice Update: Arctic Stable, Antarctic Recovering


