
Natural Sources of Global Warming and Cooling: (2) The PDO and AMO
/As a follow-on to my earlier post on solar variability and La Niña as natural sources of global cooling, this second post in the series examines the effect on our climate of two major ocean cycles – the PDO (Pacific Decadal Oscillation) and the AMO (Atlantic Multidecadal Oscillation).
Both the PDO and AMO have cycle times of 60-65 years and alternate between warm and cool phases of approximately equal length, though the warm phases of the AMO may last longer. The two cycles are compared in the following figure, which shows indexes measuring fluctuations in average Pacific (top) and Atlantic (bottom) sea surface temperature since 1854 (1856 for the AMO); red denotes the warm phase, blue the cool phase of the cycle.

PDO temperature fluctuations are greater than those of the AMO, and can be as much as 2 degrees Celsius (3.6 degrees Fahrenheit) from the mean. This is mainly because the Pacific Ocean is so much larger than the Atlantic in the tropics, the region where most of the forcing that drives the PDO and AMO occurs. It can be seen that phases of the AMO are more distinct than those of the PDO, in which the warm phase often includes cold spells and vice versa. In 2022, the PDO is in a cool phase that began either around 2000 or in 2007, but the AMO is in its warm phase.
Although the PDO can be traced back at least several centuries, its distinctive behavior wasn’t recognized until the 1990s, when it was named by a U.S. fisheries scientist trying to explain the connection between Alaskan salmon harvests and the Pacific climate. The geographic pattern has a characteristic horseshoe shape, as shown in the figure below illustrating its warm (left) and cool (right) phases; the color scale represents the percentage of selected warm or cool years since 1951 with above-normal temperatures from December to February.
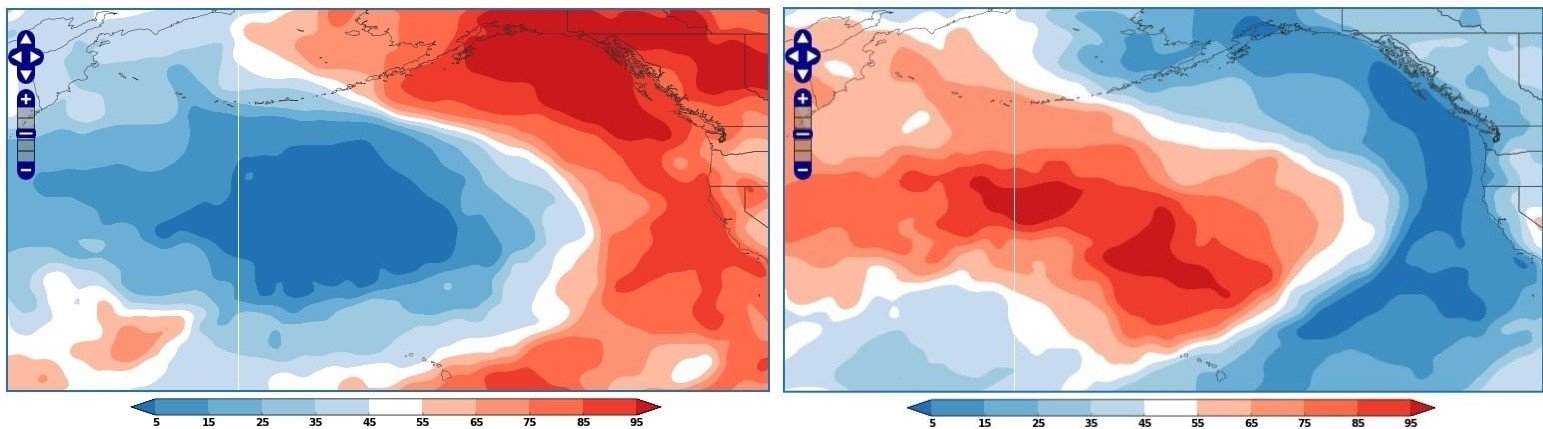
During the PDO warm phase, more El Niños occur and the southeastern U.S. is cooler and wetter than usual. Its cool phase is marked by an excess of La Niñas, and dominated by warmer, drier conditions inland. The cycle has also been linked to cold weather extremes in the U.S. and Canada.
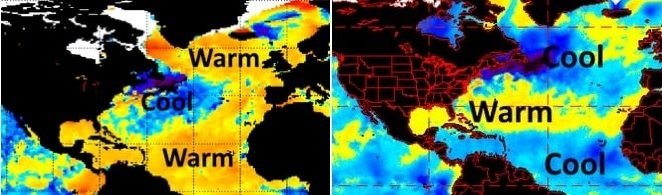
Just as the warm phase of the PDO results in warmer than normal sea surface temperatures along the west coast of North America, the warm phase of the AMO produces warm waters off the west coast of Europe and Africa, as seen in the next figure showing its warm (left) and cool (right) phases. The AMO warm phase causes intense hurricanes in the North Atlantic basin together with heavier-than-normal rainfall in Europe, leading to major flooding, but lighter rainfall in North America. This pattern is reversed during the cool phase.
So what effect, if any, do the PDO and AMO have on global warming?
While the two cycles are approximately the same length, they’ve been almost exactly out of phase since 1854, with the warm phase of one cycle almost coinciding with the cool phase of the other, as revealed in the first figure above. Were the PDO and AMO of equal strength, you’d expect the opposite phases to cancel each other.
But, because the PDO dominates as noted earlier, a rather different pattern emerges when the two indexes are combined as in the figure below. Note that the combined index is defined differently from the indexes in the first figure above; the blue line depicts annual values from 1900 to 2005, while the purple line is a 5-year running mean. It’s seen that the combined index was negative, signifying cooling, from 1900 to about 1925; positive, signifying warming, until about 1950; negative again up to 1980; and positive once more to 2005.
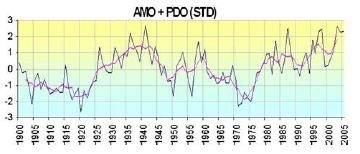
This is not too different from the behavior of the average global temperature since 1900, which went up from 1910 to 1940, down from 1940 to 1970, and upward since then – exhibiting perhaps a 10-year lag behind the combined AMO-PDO index.
Once the AMO switches back to its cool phase in about 2030, when the PDO will still be in the cool phase, strong cooling is likely. However, the actual effect of the PDO and AMO on climate is more complicated and depends not only on sea surface temperatures, but also on factors such as cloud cover – so that the correlation of these two natural cycles with global temperature may not be as real as it appears.
In addition, the PDO is no longer thought to be a single phenomenon, but rather a combination of different processes including random atmospheric forcing, large-scale teleconnections from the tropical Pacific, and changes in ocean currents. And the very existence of the AMO has been questioned, although most ocean scientists remain convinced of its reality. More research is needed to understand the influence of these two sources of natural variability on climate change.
Next: “Rescued” Victorian Rainfall Data Casts Doubt on Claims of a Wetter UK


