
Climate-Related Disasters Wrongly Linked to Global Warming by Two International Agencies
/Two 2022 reports by highly acclaimed international agencies – CRED (Centre for Research on the Epidemiology of Disasters), a Belgian non-profit, and the WMO (World Meteorological Organization), a UN agency – insist that climate-related disasters are escalating as the world warms. But the evidence shows that such a claim is indisputably wrong.
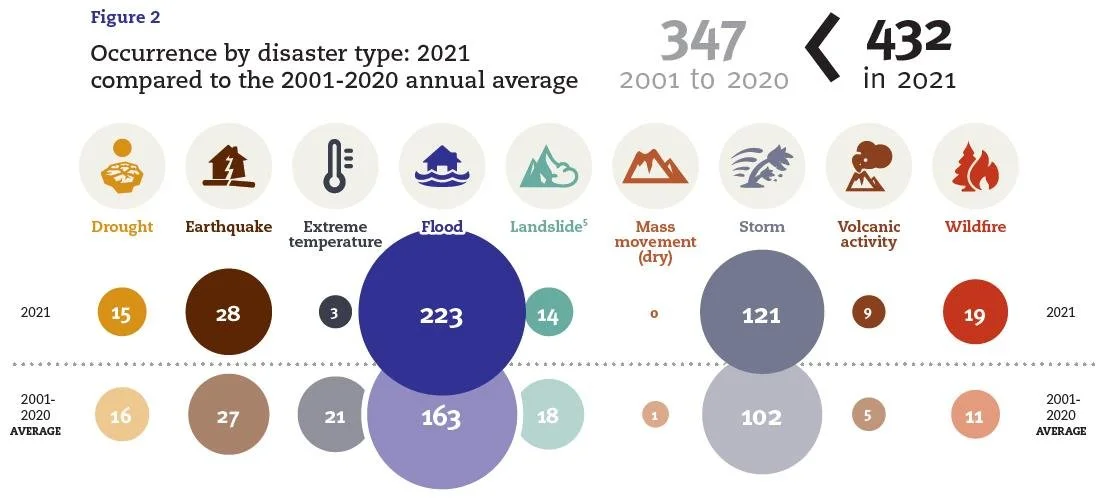
The 2022 CRED report, which covers events in 2021, draws a strong link between global warming and climate disasters, the majority of which are floods and storms. The report pointedly comments that “… 2021 was marked by an increase in the number of disaster events,” and that the total of 432 catastrophic events was “considerably higher” than the annual average of 347 catastrophic events for 2001-2020. A breakdown of these numbers by disaster category is presented in the figure below from the report.
Both CRED statements, while literally true, are dishonest as they completely ignore statistics. Although the total of 432 events for 2021 was indeed higher than the 20-year average from 2001 to 2020, the total for, say, 2018 of 289 events was lower than the 19-year annual average from 2001 to 2018 of 333 events. The individual yearly totals are unrelated – independent events in the language of statistics – and any comparison of them to a long-term average is meaningless.
The statistical inadequacy of such a comparison is also made clear by examining the long-term trend in CRED’s data. The next figure shows the yearly number of climate-related disasters globally from 2000 through 2020 by major category. The disasters are those in the yellow climatological (droughts, glacial lake outbursts and wildfires), green meteorological (storms, extreme temperatures and fog), and blue hydrological (floods, landslides and wave action) categories.

The disaster data comes from CRED’s EM-DAT (Emergency Events Database). To be recorded as a disaster, an event must meet at least one of the following criteria: 10 or more people reported killed; 100 or more people reported affected; a state of emergency declared; or a call put out for international assistance.
What the figure shows is that the total number of climate-related disasters exhibits a distinctly declining trend from 2000 to 2020, falling by 11% over 21 years. Yet the same graph for the period one year later, from 2001 to 2021, shows a decline of only 1% over that 21-year interval. As any statistician knows, both the trend and the average value of a time series are highly sensitive to the endpoints chosen. Nevertheless, the disaster trend is clearly downward.
The 2022 WMO report makes the same error as an earlier CRED report and a previous WMO report in claiming that climate-related disasters have increased significantly since 1970. A key message of the 2022 report is that “weather-related disasters have increased fivefold over the last 50 years,” as purportedly shown by the WMO figure below. The WMO data is derived from the same EM-DAT database as the CRED data.
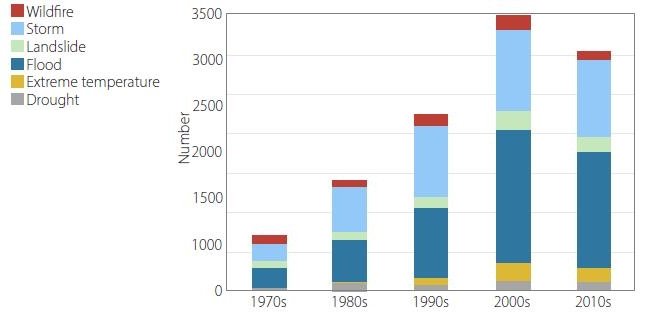
However, the WMO claim is nonsense and the figure is highly misleading. This is because, just like similar data in the earlier CRED report, the claim fails to take into account a major increase in disaster reporting since 1998 due to the arrival of the Internet. Climate writers Paul Homewood and Roger Pielke Jr. uncovered a sudden jump – a near doubling – in the annual number of disasters listed in EM-DAT in 1998 and the years thereafter. Surprisingly, CRED had acknowledged as much both in its 2004 disaster report:
Over the past 30 years, development in telecommunications, media and increased international cooperation has played a critical role in the number of disasters reported at an international level. In addition, increases in humanitarian funds have encouraged reporting of more disasters, especially smaller events that were previously managed locally.
and even more explicitly in its 2006 disaster report:
Two periods can be distinguished: 1987–1997, with the number of disasters varying generally between 200 and 250; and 2000–2006, with the number of disasters increasing by nearly a multiple factor of two. An increase of this magnitude can be partially explained by increased reporting of disasters, particularly by press organizations and specialized agencies.
That the impact of natural disasters is diminishing over time can be seen in data on the associated loss of life. The next figure illustrates the annual global number of deaths from natural disasters, including weather extremes, from 1900 to 2015, corrected for population increase over time and averaged by decade.

Because the data is compiled from the same EM-DAT database, the annual number of deaths shows an uptick from the 1990s to the 2000s. It is clear though that disaster-related deaths from extreme weather have been falling since the 1920s and are now approaching zero. This is due as much to improved planning, more robust structures and early warning systems, as it is to diminishing numbers of natural disasters. And, as can be seen from the figure, it is earthquakes – entirely natural events – that have been the deadliest disasters over the last two decades.
Ignoring all the evidence, however, the press release accompanying the latest WMO report proclaims that “Climate science is clear: we are heading in the wrong direction,” the UN Secretary-General adding, with characteristic hype, that the report “shows climate impacts heading into uncharted territory of destruction.”
A more detailed discussion of the erroneous claims of both CRED and the WMO can be found in my two most recent reports on weather extremes (here and here).
Next: The Scientific Method at Work: The Carbon Cycle Revisited, Again


