Latest Computer Climate Models Run Almost as Hot as Before

The narrative that global warming is largely human-caused and that we need to take drastic action to control it hinges entirely on computer climate models. It’s the models that forecast an unbearably hot future unless we rein in our emissions of CO2.

But the models have a dismal track record. Apart from failing to predict a recent slowdown in global warming in the early 2000s, climate models are known even by modelers to consistently run hot. The previous generation of models, known in the jargon as CMIP5 (Coupled Model Intercomparison Project Phase 5), overestimated short-term warming by more than 0.5 degrees Celsius (0.9 degrees Fahrenheit) above observed temperatures. That’s 50% of all the global warming since preindustrial times.

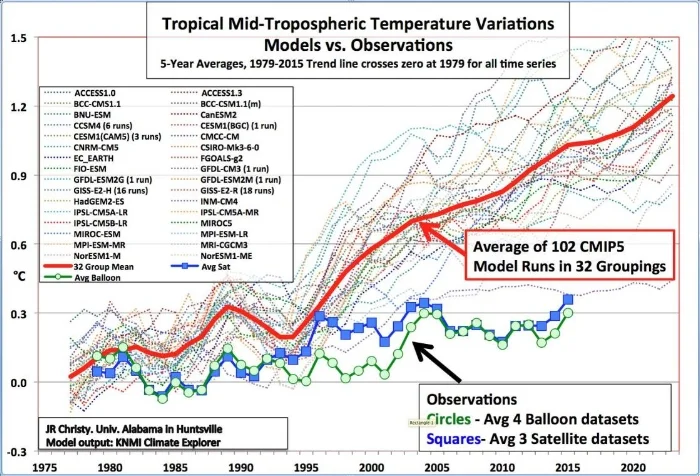
The new CMIP6 models aren’t much better. The following two figures reveal just how much both CMIP5 and CMIP6 models exaggerate predicted temperatures, and how little the model upgrade has done to shrink the difference between theory and observation. The figures were compiled by climate scientist John Christy, who is Director of the Earth System Science Center at the University of Alabama in Huntsville and an expert reviewer of the upcoming sixth IPCC (Intergovernmental Panel on Climate Change) report.

Models CMIP5.jpg
Models CMIP6.jpg

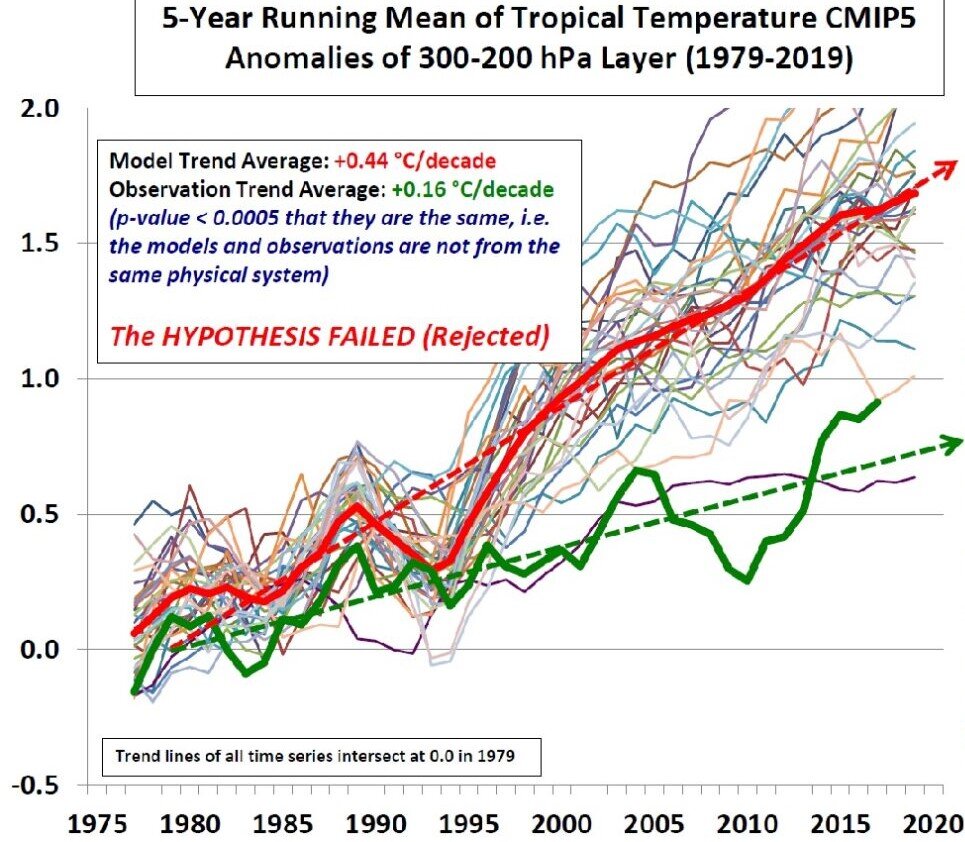
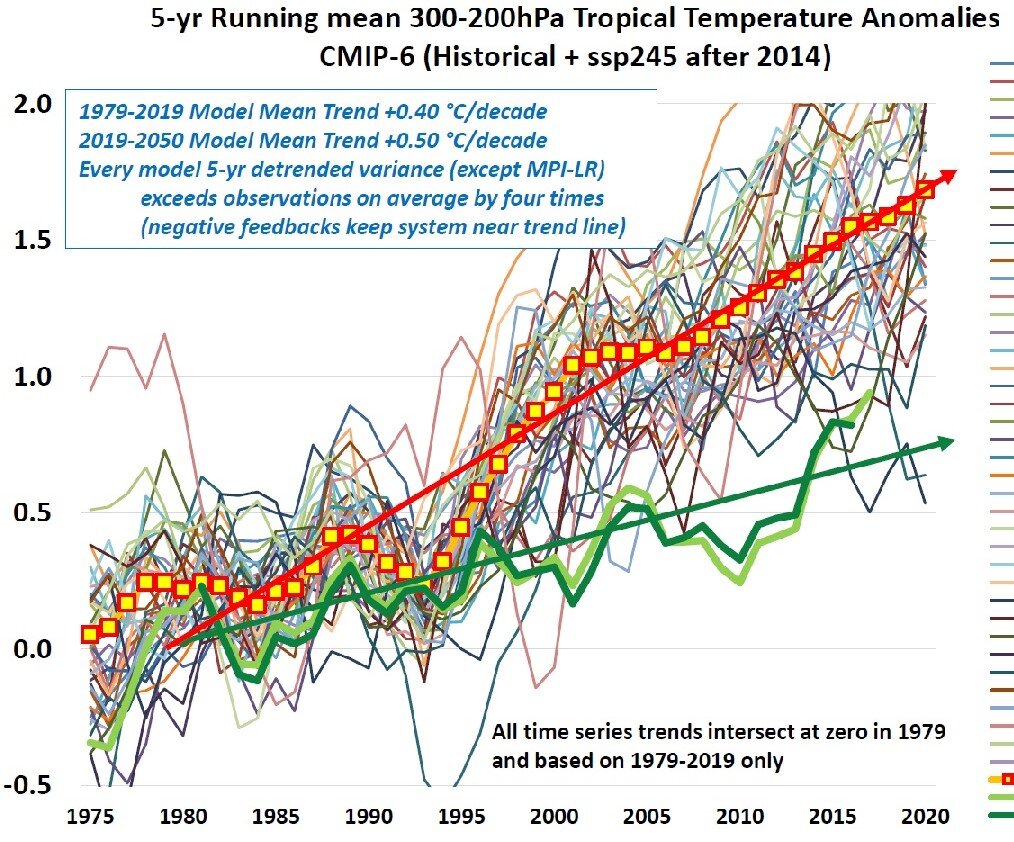
Both figures plot the warming relative to 1979 in degrees Celsius, measured in a band in the tropical upper atmosphere between altitudes of approximately 9 km (30,000 feet) and 12 km (40,000 feet). That’s a convenient band for comparison of model predictions with measurements made by weather balloons and satellites. The thin colored lines indicate the predicted variation of temperature with time for the different models, while the thick red and green lines show the mean trend for models and observations, respectively.

The trend for CMIP6 models is depicted more clearly in Christy’s next figure, which compares the warming rates for 39 of the models. The average CMIP6 trend in warming rate is 0.40 degrees Celsius (0.72 degrees Fahrenheit) per decade, compared with the actual observed rate of 0.17 degrees Celsius (0.31 degrees Fahrenheit) per decade – meaning that the predicted warming rate is 2.35 times too high.

Models CMIP6 warming rate.jpg

These CMIP6 numbers are only a marginal improvement over those predicted by the older CMIP5 models, for which the warming trend was 0.44 degrees Celsius (0.72 degrees Fahrenheit) per decade, or 2.75 times higher than the observed rate of 0.16 degrees Celsius (0.29 degrees Fahrenheit) per decade (for a slightly different set of measurements),

It’s seen that the warming rates for any particular model fluctuate wildly in both cases, much more so than the observations themselves. Christy says the large variability is a sign that the models underestimate negative feedbacks in the climate system, especially from clouds that I’ve discussed in another post. Negative feedback is stabilizing and acts to damp down processes that cause fluctuations. There is evidence, albeit controversial, that feedback from high clouds such as cirrus clouds – which normally warm the planet – may not be as strongly positive as the new models predict, and could even be negative overall.

You may be wondering why all these comparisons between models and observations are made high up in the atmosphere, rather than at the earth’s surface which is where we actually feel global warming. The reason is the atmosphere at 9 to 12 km (6 to 7 miles) above the tropics is a much more sensitive test of CO2 greenhouse warming than it is near the ground. Computer climate models predict that the warming rate at those altitudes should be about twice as large as at ground level, giving rise to the so-called CO2 “hot spot.”

The hot spot is illustrated in the figure below, showing the air temperature as a function of both altitude (measured as atmospheric pressure) and global latitude, as predicted by a Canadian model. Similar predictions come from the other CMIP6 models. The hot spot is the red patch at the center of the figure bounded by the 0.6 degrees Celsius (1.1 degrees Fahrenheit) contour, extending roughly 20o either side of the equator and at altitudes of 30,000-40,000 feet. The corresponding temperature on the ground is seen to be less than 0.3 degrees Celsius (0.5 degrees Fahrenheit).

Hot spot.jpg

But the hot spot doesn’t show up in measurements made by weather balloons or satellites. This mismatch between models and experiment is important because the 30,000-40,000 feet band in the atmosphere is the very altitude from which infrared heat is radiated away from the earth. The models run hot, according to Christy, because they trap too much heat that in reality is lost to outer space – a consequence of insufficient negative feedback in the models.

Next: Growing Antarctic Sea Ice Defies Climate Models

What Triggered the Ice Ages? The Uncertain Role of CO2

About a million years ago, the earth’s ice ages became colder and longer – with a geologically sudden jump from thinner, smaller glaciers that came and went every 41,000 years to thicker, larger ice sheets that persisted for 100,000 years. Although several hypotheses have been put forward to explain this transition, including a long-term decline in the atmospheric CO2 level, the phenomenon remains a scientific conundrum.

Two research teams spearheaded by geologists from Princeton University have recently described their attempts to resolve the mystery. A 2019 study measured the CO2 content in two-million-year-old ice cores extracted from Antarctica, which are by far the oldest cores ever recovered and span the puzzling transition to a 100,000-year ice age cycle that occurred a million years before. A just reported 2020 study utilized seabed sediment cores from the Antarctic Ocean to investigate storing of CO2 in the ocean depths over the last 150,000 years.

Both studies recognize that the prolonged deep freezes of the ice ages are set off partly by perpetual but regular changes in the earth’s orbit around the sun. That’s the basis of a hypothesis proposed by Serbian engineer and meteorologist Milutin Milankovitch. As shown in the figure below, the earth orbits the sun in an elliptical path and spins on an axis that is tilted. The elliptical orbit stretches and contracts over a 100,000-year cycle (top), while the angle of tilt or obliquity oscillates with a 41,000-year period (bottom), and the planet also wobbles on its axis in a 26,000-year cycle (center).

94_card_with_border.jpg

Milankovitch linked all three cycles to glaciation, but his hypothesis has been dogged by two persistent problems. First, it predicts a dominant 41,000-year cycle governed by obliquity, whereas the current pattern is ruled by the 100,000-year eccentricity cycle as mentioned above. Second, the orbital fluctuations thought to trigger the extended cooling cycles are too subtle to cause on their own the needed large changes in solar radiation reaching the planet – known as insolation. That’s where CO2 comes in, as one of various feedbacks that amplify the tiny changes that do occur.

Before the 2019 Princeton study, it had been suspected that the transition from 41,000-year to 100,000-year cycles was due to a long-term decline in the atmospheric CO2 level over both glacial and interglacial epochs. But that belief held when ice-core data went back only about 800,000 years. Armed with their new data from 2 million years in the past, the first Princeton team discovered surprisingly that the average CO2 level was unchanged over that time span, even though the minimum level dropped after the transition to longer ice age cycles.

This means that the 100,000-year transition can’t be attributed to CO2, although CO2 feedback has been invoked to explain the relatively sudden temperature rise at the end of ice ages. Rather, said the study authors, the switch in ice age length was probably caused by enhanced growth of ice sheets or changes in global ocean circulation.

It’s another feedback process involving CO2 that was investigated by the second Princeton team, who made measurements on tiny fossils embedded in Antarctic Ocean sediments. While it has long been known that the atmospheric CO2 level and global temperatures varied in tandem over glacial cycles, and that CO2 lagged temperature, the causes of the CO2 fluctuations are not well understood.

We know that the oceans can hold more CO2 than the atmosphere. Because CO2 is less soluble in warm water than cooler water, CO2 is absorbed from the atmosphere by cold ocean water at the poles and released by warmer water at the equator. The researchers found that, during ice ages, the Antarctic Ocean stored even more CO2 than expected. Absorption in the Antarctic is enabled by the sinking of floating algae that carry CO2 deep into the ocean before becoming fossilized, a process referred to as the "biological carbon pump."

But some of the sequestered CO2 normally escapes, due to the strong eastward winds encircling Antarctica that drag CO2-rich deep water up to the surface and vent the CO2 back to the atmosphere. The new research provides evidence that this wind-driven Antarctic Ocean upwelling slowed down during the ice ages, allowing less CO2 to be vented and more to remain locked up in the ocean waters.

Apart from any effect this retention of CO2 may have had on ice-age temperatures, the researchers say their data suggests that the past lag of CO2 behind temperature may have been caused directly by the effect on Antarctic upwelling of changing obliquity in the earth’s orbit – Milankovitch’s 41,000-year cycle. The study authors believe this explains why the eccentricity and precession cycles now prevail over the obliquity cycle.

Next: Both Greenland and Antarctic Ice Sheets Melting from Below

The Scientific Method at Work: The Carbon Cycle Revisited

The crucial test of any scientific hypothesis is whether its predictions match real-world observations. If empirical evidence doesn’t confirm the predictions, the hypothesis is falsified. The scientific method then demands that the hypothesis be either tossed out, or modified to fit the evidence. This post illustrates just such an example of the scientific method at work.

The hypothesis in question is a model of the carbon cycle, which describes quantitatively the exchange of carbon between the earth’s land masses, atmosphere and oceans, proposed by physicist Ed Berry and described in a previous post. Berry argues that natural emissions of CO2 since 1750 have increased as the world has warmed, contrary to the CO2 global warming hypothesis, and that only 25% of the increase in atmospheric CO2 after 1750 is due to humans.

One prediction of his model, not described in my earlier post, involves the atmospheric concentration of the radioactive carbon isotope 14C, produced by cosmic rays interacting with nitrogen in the upper atmosphere. It’s the isotope commonly used for radiocarbon dating. With a half-life of 5,730 years, 14C is absorbed by living but not dead biological matter, so the amount of 14C remaining in a dead animal or plant is a measure of the time elapsed since its death. Older fossils contain less 14C than more recent ones.

Berry’s prediction is of the recovery since 1970 of the 14C level in atmospheric CO2, a level that became elevated by radioactive fallout from above-ground nuclear bomb testing in the 1950s and 1960s. The atmospheric concentration of 14C almost doubled following the tests and has since been slowly dropping – at the same time as concentrations of the stable carbon isotopes 12C and 13C, generated by fossil-fuel burning, have been steadily rising. Because the carbon in fossil fuels is millions of years old, all the 14C in fossil-fuel CO2 has decayed away.

The recovery in 14C concentration predicted by Berry’s model is illustrated in the figure below, where the solid line purportedly shows the empirical data and the black dots indicate the model’s predicted values from 1970 onward. It appears that the model closely replicates the experimental observations which, if true, would verify the model.

Carbon14 Berry.jpg

However, as elucidated recently by physicist David Andrews, the prediction is flawed because the data depicted by the solid line in the figure are not the concentration of 14C, but rather its isotopic or abundance ratio relative to 12C. This ratio is most often expressed as the “delta value” Δ14C, calculated from the isotopic ratio R = 14C/12C as

Δ14C = 1000 x (Rsample/Rstandard – 1), measured in parts per thousand.

The relationship between Δ14C and the 14C concentration is

14C conc = (total carbon conc) x Rstandard x (Δ14C/1000 + 1).

Unfortunately, Berry has failed to distinguish between Δ14C and 14C concentration. As Andrews remarks, “as Δ14C [calculated from measured isotope ratios] approaches zero in 2020, this does not mean that 14C concentrations have nearly returned to 1955 values. It means that the isotope abundance ratio has nearly returned to its previous value. Therefore, since atmospheric 12CO2 has increased by about 30% since 1955, the 14C concentration remains well above its pre-bomb test value.”

This can be seen clearly in the next figure, showing Andrews’ calculations of the atmospheric 14CO2 concentration compared to the experimentally measured concentration of all CO2 isotopes, in parts per million by volume (ppmv), over the last century. The behavior of the 14CO2 concentration after 1970 is unquestionably different from that of Δ14C in the previous figure, the current concentration leveling off at close to 350 ppmv, about 40% higher than its 1955 pre-bomb spike value, rather than reverting to that value. In fact, the 14CO2 concentration is currently increasing.

Carbon 14 Andrews.jpg

At first, it seems that the 14CO2 concentration in the atmosphere should decrease with time as fossil-fuel CO2 is added, since fossil fuels are devoid of 14C. The counterintuitive increase arises from the exchange of CO2 between the atmosphere and oceans. Normally, there’s a balance between 14CO2 absorbed from the atmosphere by cooler ocean water at the poles and 14CO2 released into the atmosphere by warmer water at the equator. But the emission of 14C-deficient fossil-fuel CO2 into the atmosphere perturbs this balance, with less 14CO2 now being absorbed by the oceans than released. The net result is a buildup of 14CO2 in the atmosphere.

As the figures above show, the actual 14C concentration data falsify Berry’s model, as well as other similar ones (see here and here). The models, therefore, must be modified in order to accurately describe the carbon cycle, if not discarded altogether.

The importance of hypothesis testing was aptly summed up by Nobel Prize winning physicist Richard Feynman (1918-88), who said in a lecture on the scientific method:

If it [the hypothesis] disagrees with experiment, it’s WRONG.  In that simple statement is the key to science.  It doesn’t make any difference how beautiful your guess is, it doesn’t matter how smart you are, who made the guess, or what his name is … If it disagrees with experiment, it’s wrong.  That’s all there is to it.

Next: How Clouds Hold the Key to Global Warming

Challenges to the CO2 Global Warming Hypothesis: (3) The Greenhouse Effect Doesn’t Exist

This final post of the present series reviews two papers that challenge the CO2 global warming hypothesis by purporting to show that there is no greenhouse effect, a heretical claim that even global warming skeptics such as me find hard to accept. According to the authors of the two papers, greenhouses gases in the earth’s atmosphere have played no role in heating the earth, either before or after human emissions of such gases began.

The first paper, published in 2017, utilizes the mathematical tool of dimensional analysis to identify which climatic forcings govern the mean surface temperature of the rocky planets and moons in the solar system that have atmospheres: Venus, Earth, Mars, our Moon, Europa (a moon of Jupiter), Titan (a moon of Saturn) and Triton (a moon of Neptune). A forcing is a disturbance that alters climate, producing heating or cooling.

The paper’s authors, U.S. research scientists Ned Nikolov and Karl Zeller, claim that planetary temperature is controlled by only two forcing variables. These are the total solar irradiance, or total energy from the sun incident on the atmosphere, and the total atmospheric pressure at the planet’s (or moon’s) surface.

In addition to solar irradiance and atmospheric pressure, other forcings considered by Nikolov and Zeller include the near-surface partial pressure and density of greenhouse gases, as well as the mean planetary surface temperature without any greenhouse effect. In their model, the radiative effects integral to the greenhouse effect are replaced by a previously unknown thermodynamic relationship between air temperature, solar heating and atmospheric pressure, analogous to compression heating of the atmosphere. Their findings are illustrated in the figure below, in which Ts is the surface temperature and Tna the temperature with no atmosphere.

Nikolov.jpg

A surprising result of their study is that the earth’s natural greenhouse effect – from the greenhouse gases already present in Earth’s preindustrial atmosphere, without any extra CO2 – warms the planet by a staggering 90 degrees Celsius. This is far in excess of the textbook value of 33 degrees Celsius, or the 18 degrees Celsius calculated by Denis Rancourt and discussed in my previous post. The same 90 degrees Celsius result had also been derived by Nikolov and Zeller from an analytical model, rather than dimensional analysis, in a 2014 paper published under pseudonyms (consisting of their names spelled backwards).

Needless to say, Nikolov and Zeller’s work has been heavily criticized by climate change alarmists and skeptics alike. Skeptical climate scientist Roy Spencer, who has a PhD in meteorology, argues that compression of the atmosphere can’t explain greenhouse heating, because Earth’s average surface temperature is determined not by air pressure, but by the rates at which energy is gained or lost by the surface.

Spencer argues that, if atmospheric pressure causes the lower troposphere (the lowest layer of the atmosphere) to be warmer than the upper troposphere, then the same should be true of the stratosphere, where the pressure at the bottom of the stratosphere is about 100 times larger than that at the top. Yet the bottom of the stratosphere is cooler than the top.

In a reply, Nikolov and Zeller fail to address Spencer’s stratosphere argument, but attempt to defend their work by claiming incorrectly that Spencer ignores the role of adiabatic processes and focuses instead on diabatic radiative processes. Adiabatic processes alter the temperature of a gaseous system without any exchange of heat energy with its surroundings.

The second paper rejecting the greenhouse effect was published in 2009 by German physicists Gerhard Gerlich and Ralf Tscheuschner. They claim that the radiative mechanisms of the greenhouse effect – the absorption of solar shortwave radiation and emission of longwave radiation, which together trap enough of the sun’s heat to make the earth habitable – are fictitious and violate the Second Law of Thermodynamics.

The Second Law forbids the flow of heat energy from a cold region (the atmosphere) to a warmer one (the earth’s surface) without supplying additional energy in the form of external work. However, as other authors point out, the Second Law is not contravened by the greenhouse effect because external energy is provided by downward solar shortwave radiation, which passes through the atmosphere without being absorbed. The greenhouse effect arises from downward emission from the atmosphere of radiation previously emitted upward from the earth.

Furthermore, there’s a net upward transfer of heat energy from the warmer surface to the colder atmosphere when all energy flows are taken into account, including non-radiative convection and latent heat transfer associated with water vapor. Gerlich and Tscheuschner mistakenly insist that heat and energy are separate quantities.

Both of these farfetched claims that the greenhouse effect doesn’t exist therefore stem from misunderstandings about energy.

Next: Science on the Attack: The Hunt for a Coronavirus Vaccine (1)

Challenges to the CO2 Global Warming Hypothesis: (2) Questioning Nature’s Greenhouse Effect

A different challenge to the CO2 global warming hypothesis from that discussed in my previous post questions the magnitude of the so-called natural greenhouse effect. Like the previous challenge, which was based on a new model for the earth’s carbon cycle, the challenge I’ll review here rejects the claim that human emissions of CO2 alone have caused the bulk of current global warming.

It does so by disputing the widely accepted notion that the natural greenhouse effect – produced by the greenhouse gases already present in Earth’s preindustrial atmosphere, without any added CO2 – causes warming of about 33 degrees Celsius (60 degrees Fahrenheit). Without the natural greenhouse effect, the globe would be 33 degrees Celsius cooler than it is now, too chilly for most living organisms to survive.

The controversial assertion about the greenhouse effect was made in a 2011 paper by Denis Rancourt, a former physics professor at the University of Ottawa in Canada, who says that the university opposed his research on the topic. Based on radiation physics constraints, Rancourt finds that the planetary greenhouse effect warms the earth by only 18 degrees, not 33 degrees, Celsius. Since the mean global surface temperature is currently 15.0 degrees Celsius, his result implies a mean surface temperature of -3.0 degrees Celsius in the absence of any atmosphere, as opposed to the conventional value of -18.0 degrees Celsius.

In addition, using a simple two-layer model of the atmosphere, Rancourt finds that the contribution of CO2 emissions to current global warming is only 0.4 degrees Celsius, compared with the approximately 1 degree Celsius of observed warming since preindustrial times.

Actual greenhouse warming, he says, is a massive 60 degrees Celsius, but this is tempered by various cooling effects such as evapotranspiration, atmospheric thermals and absorption of incident shortwave solar radiation by the atmosphere. These effects are illustrated in the following figure, showing the earth’s energy flows (in watts per square meter) as calculated from satellite measurements between 2000 and 2004. It should be noted, however, that the details of these energy flow calculations have been questioned by global warming skeptics.

radiation_budget_kiehl_trenberth_2008_big.jpg

The often-quoted textbook warming of 33 degrees Celsius comes from assuming that the earth’s mean albedo, which measures the reflectivity of incoming sunlight, is the same 0.30 with or without its atmosphere. The albedo with an atmosphere, including the contribution of clouds, can be calculated from the shortwave satellite data on the left side of the figure above, as (79+23)/341 = 0.30. Rancourt calculates the albedo with no atmosphere from the same data, as 23/(23+161) = 0.125, which assumes the albedo is the same as that of the earth’s present surface.

This value is considerably less than the textbook value of 0.30. However, the temperature of an earth with no atmosphere – whether it’s Rancourt’s -4.0 degrees Celsius or a more frigid -19 degrees Celsius – would be low enough for the whole globe to be covered in ice.

Such an ice-encased planet, a glistening white ball as seen from space known as a “Snowball Earth,” is thought to have existed hundreds of millions of years ago. What’s relevant here is that the albedo of a Snowball Earth would be at least 0.4 (the albedo of marine ice) and possibly as high as 0.9 (the albedo of snow-covered ice).

That both values are well above Rancourt’s assumed value of 0.125 seems to cast doubt on his calculation of -4.0 degrees Celsius as the temperature of an earth stripped of its atmosphere. His calculation of CO2 warming may also be on weak ground because, by his own admission, it ignores factors such as inhomogeneities in the earth’s atmosphere and surface; non-uniform irradiation of the surface; and constraints on the rate of decrease of temperature with altitude in the atmosphere, known as the lapse rate. Despite these limitations, Rancourt finds with his radiation balance approach that his double-layer atmosphere model yields essentially the same result as a single-layer model.

He also concludes that the steady state temperature of Earth’s surface is a sizable two orders of magnitude more sensitive to variations in the sun’s heat and light output, and to variations in planetary albedo due to land use changes, than to increases in the level of CO2 in the atmosphere. These claims are not accepted even by the vast majority of climate change skeptics, despite Rancourt’s accurate assertion that global warming doesn’t cause weather extremes.

Next: Challenges to the CO2 Global Warming Hypothesis: (3) The Greenhouse Effect Doesn’t Exist

Challenges to the CO2 Global Warming Hypothesis: (1) A New Take on the Carbon Cycle

Central to the dubious belief that humans make a substantial contribution to climate change is the CO2 global warming hypothesis. The hypothesis is that observed global warming – currently about 1 degree Celsius (1.8 degrees Fahrenheit) since the preindustrial era – has been caused primarily by human emissions of CO2 and other greenhouse gases into the atmosphere. The CO2 hypothesis is based on the apparent correlation between rising worldwide temperatures and the CO2 level in the lower atmosphere, which has gone up by approximately 47% over the same period.

In this series of blog posts, I’ll review several recent research papers that challenge the hypothesis. The first is a 2020 preprint by U.S. physicist and research meteorologist Ed Berry, who has a PhD in atmospheric physics. Berry disputes the claim of the IPCC (Intergovernmental Panel on Climate Change) that human emissions have caused all of the CO2 increase above its preindustrial level in 1750 of 280 ppm (parts per million), which is one way of expressing the hypothesis.

The IPCC’s CO2 model maintains that natural emissions of CO2 since 1750 have remained constant, keeping the level of natural CO2 in the atmosphere at 280 ppm, even as the world has warmed. But Berry’s alternative model concludes that only 25% of the current increase in atmospheric CO2 is due to humans and that the other 75% comes from natural sources. Both Berry and the IPCC agree that the preindustrial CO2 level of 280 ppm had natural origins. If Berry is correct, however, the CO2 global warming hypothesis must be discarded and another explanation found for global warming.

Natural CO2 emissions are part of the carbon cycle that accounts for the exchange of carbon between the earth’s land masses, atmosphere and oceans; it includes fauna and flora, as well as soil and sedimentary rocks. Human CO2 from burning fossil fuels constitutes less than 5% of total CO2 emissions into the atmosphere, the remaining emissions being natural. Atmospheric CO2 is absorbed by vegetation during photosynthesis, and by the oceans through precipitation. The oceans also release CO2 as the temperature climbs.

Berry argues that the IPCC treats human and natural carbon differently, instead of deriving the human carbon cycle from the natural carbon cycle. This, he says, is unphysical and violates the Equivalence Principle of physics. Mother Nature can't tell the difference between fossil fuel CO2 and natural CO2. Berry uses physics to create a carbon cycle model that simulates the IPCC’s natural carbon cycle, and then utilizes his model to calculate what the IPCC human carbon cycle should be.

Berry’s physics model computes the flow or exchange of carbon between land, atmosphere, surface ocean and deep ocean reservoirs, based on the hypothesis that outflow of carbon from a particular reservoir is equal to its level or mass in that reservoir divided by its residence time. The following figure shows the distribution of human carbon among the four reservoirs in 2005, when the atmospheric CO2 level was 393 ppm, as calculated by the IPCC (left panel) and Berry (right panel).

Human carbon IPCC.jpg
Human carbon Berry.jpg

A striking difference can be seen between the two models. The IPCC claims that approximately 61% of all carbon from human emissions remained in the atmosphere in 2005, and no human carbon had flowed to land or surface ocean. In contrast, Berry’s alternative model reveals appreciable amounts of human carbon in all reservoirs that year, but only 16% left in the atmosphere. The IPCC’s numbers result from assuming in its human carbon cycle that human emissions caused all the CO2 increase above its 1750 level.

The problem is that the sum total of all human CO2 emitted since 1750 is more than enough to raise the atmospheric level from 280 ppm to its present 411 ppm, if the CO2 residence time in the atmosphere is as long as the IPCC claims – hundreds of years, much longer than Berry’s 5 to 10 years. The IPCC’s unphysical solution to this dilemma, Berry points out, is to have the excess human carbon absorbed by the deep ocean alone without any carbon remaining at the ocean surface.

Contrary to the IPCC’s claim, Berry says that human emissions don’t continually add CO2 to the atmosphere, but rather generate a flow of CO2 through the atmosphere. In his model, the human component of the current 131 (= 411-280) ppm of added atmospheric CO2 is only 33 ppm, and the other 98 ppm is natural.

The next figure illustrates Berry’s calculations, showing the atmospheric CO2 level above 280 ppm for the period from 1840 to 2020, including both human and natural contributions. It’s clear that natural emissions, represented by the area between the blue and red solid lines, have not stayed at the same 280 ppm level over time, but have risen as global temperatures have increased. Furthermore, the figure also demonstrates that nature has always dominated the human contribution and that the increase in atmospheric CO2 is more natural than human.

Human carbon summary.jpg

Other researchers (see, for example, here and here) have come to much the same conclusions as Berry, using different arguments.

Next: Challenges to the CO2 Global Warming Hypothesis: (2) Questioning Nature’s Greenhouse Effect

Evidence Lacking for Major Human Role in Climate Change

Conventional scientific wisdom holds that global warming and consequent changes in the climate are primarily our own doing. But what few people realize is that the actual scientific evidence for a substantial human contribution to climate change is flimsy. It requires highly questionable computer climate models to make the connection between global warming and human emissions of carbon dioxide (CO2).

The multiple lines of evidence which do exist are simply evidence that the world is warming, not proof that the warming comes predominantly from human activity. The supposed proof relies entirely on computer models that attempt to simulate the earth’s highly complex climate, and include greenhouse gases as well as aerosols from both volcanic and man-made sources – but almost totally ignore natural variability.

So it shouldn’t be surprising that the models have a dismal track record in predicting the future. Most spectacularly, the models failed to predict the recent pause or hiatus in global warming from the late 1990s to about 2014. During this period, the warming rate dropped to only a third to a half of the rate measured from the early 1970s to 1998, while at the same time CO2 kept spewing into the atmosphere. Out of 32 climate models, only a lone Russian model came anywhere close to the actual observations.

Blog1 image JPG.jpg

Not only did the models overestimate the warming rate by two or three times, they wrongly predict a hot spot in the upper atmosphere that isn’t there, and are unable to accurately reproduce sea level rise.

Yet it’s these same failed models that underpin the whole case for catastrophic consequences of man-made climate change, a case embodied in the 2015 Paris Agreement. The international agreement on reducing greenhouse gas emissions – which 195 nations, together with many of the world’s scientific societies and national academies, have signed on to – is based not on empirical evidence, but on artificial computer models. Only the models link climate change to human activity. The empirical evidence does not.

Proponents of human-caused global warming, including a majority of climate scientists, insist that the boost to global temperatures of about 1.6 degrees Fahrenheit (0.9 degrees Celsius) since 1850 comes almost exclusively from the steady increase in the atmospheric CO2 level. They argue that elevated CO2 must be the cause of nearly all the warming because the sole major change in climate “forcing” over this period has been from CO2 produced by human activities – mainly the burning of fossil fuels as well as deforestation.

But correlation is not causation, as is well known from statistics or the public health field of epidemiology. So believers in the narrative of catastrophic anthropogenic (human-caused) climate change fall back on computer models to shore up their argument. With the climate change narrative trumpeted by political entities such as the UN’s IPCC (Intergovernmental Panel on Climate Change), and amplified by compliant media worldwide, predictions of computer climate models have acquired the status of quasi-religious edicts.

Indeed, anyone disputing the conventional wisdom is labeled a “denier” by advocates of climate change orthodoxy, who claim that global warming skeptics are just as anti-science as those who believe vaccines cause autism. The much-ballyhooed war on science typically lumps climate change skeptics together with creationists, anti-vaccinationists and anti-GMO activists. But the climate warmists are the ones on the wrong side of science.

Like their counterparts in the debate over the safety of GMOs, warmists employ fear, hyperbole and heavy-handed political tactics in an attempt to shut down debate. Yet skepticism about the human influence on global warming persists, and may even be growing among the general public. In 2018, a Gallup poll in the U.S. found that 36% of Americans don’t believe that global warming is caused by human activity, while a UK survey showed that a staggering 64% of the British public feel the same way. And the percentage of climate scientists who endorse the mainstream view of a strong human influence is nowhere near the widely believed 97%, although it’s probably above 50%.

Most scientists who are skeptics like me accept that global warming is real, but not that it’s entirely man-made or that it’s dangerous. The observations alone aren’t evidence for a major human role. Such lack of regard for the importance of empirical evidence, and misguided faith in the power of deficient computer climate models, are abuses of science.

(Another 189 comments on this post can be found at the What's Up With That blog and the NoTricksZone blog, which have kindly reproduced the whole post.)