How Much of a Threat Are Melting Ice Sheets and Glaciers?
/The recent tragic and catastrophic Himalayan flash flood has brought to the fore an important question: how much do we need to be concerned about melting ice, from both glaciers and ice sheets?
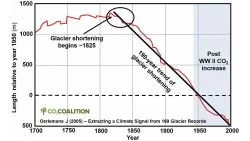
Glaciers are found all over the planet. They number over 200,000 excluding the massive ice sheets of Antarctica and Greenland. Unsurprisingly, most glaciers are retreating as the world warms. However, what is not well known is that the retreat began early in the 19th century as global temperatures started to rise following the Little Ice Age – long before human CO2 emissions became significant. This is illustratedin the figure below.
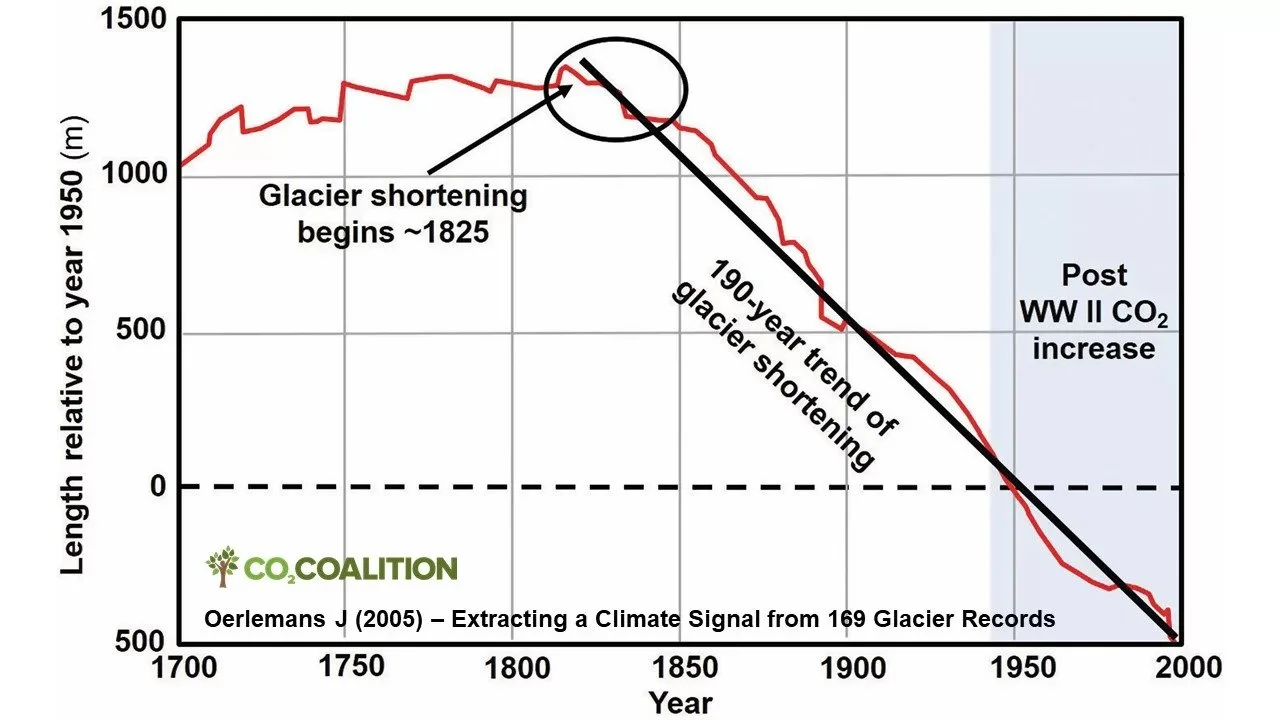
It has been estimated that complete melting of all Earth's glaciers and ice sheets will take several thousand years, but smaller mountain glaciers could vanish during this century. Nevertheless, not all glaciers are retreating. About 10% are actually advancing or periodically advancing and retreating. Recent surveys have found advancing glaciers in Alaska, Norway and Switzerland, for example.
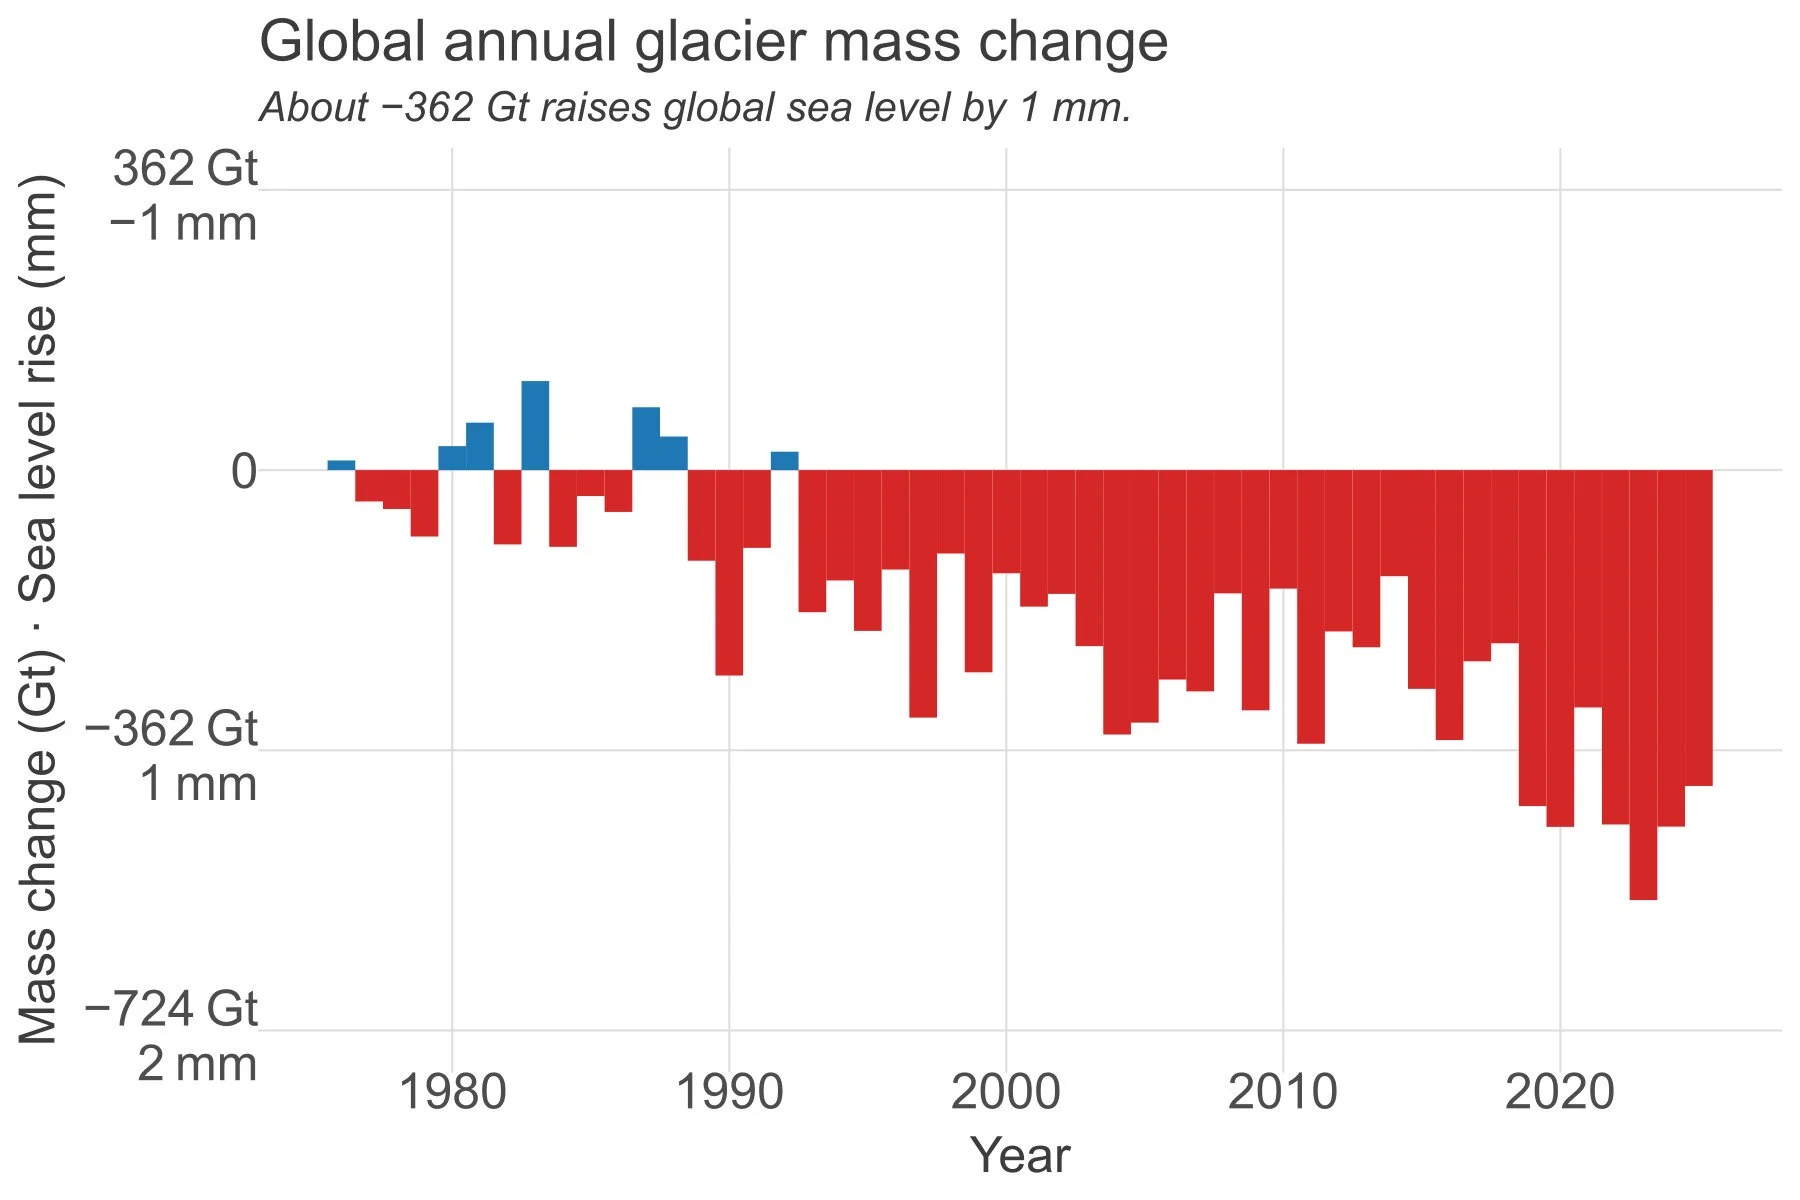
Like ice sheets, melting glaciers – including those in Antarctica and Greenland – contribute to rising sea levels. At present, this contribution is 25-30% of the observed increase in global sea levels, corresponding to an annual rise of approximately 1 mm as shown in the next figure. The mass change is measured in billions of tonnes (gigatonnes, Gt where 1 gigatonne = 1.102 U.S. gigatons).
But for mountain glaciers, a bigger threat than their contribution to sea level rise is the flash flooding caused by melting ice, especially from those glaciers that are not in remote areas but close to human settlements.
Despite the claims of climate alarmists that the devasting flood in Nepal and Tibet was caused by global-warming induced glacial collapse, scientists soon figured out that the source of the calamitous event was actually a landslide of the underlying bedrock. This resulted in a massive chunk of the glacier breaking off and falling about 2 km (7,000 feet) into a river, the shattered ice gathering rock debris, sediment and river water as it rushed downstream at speeds approaching 150 km per hour (90 mph).
Regardless of the cause, the flood was devastating in terms of loss of life and property. Many commentators have pointed out, however, that the flood would have been less deadly had an early warning system been in place, allowing people to escape to higher ground or evacuate – as is found elsewhere in the world in areas subject to natural disasters. Improvements in planning and engineering to safeguard structures may have minimized property damage too.
The mass loss from glaciers currently dominates that from the ice sheets of Antarctica and Greenland, which together store about 99% of all the fresh water on Earth. The following figure shows the annual rate of ice mass loss from all three sources between 2000 and 2019.
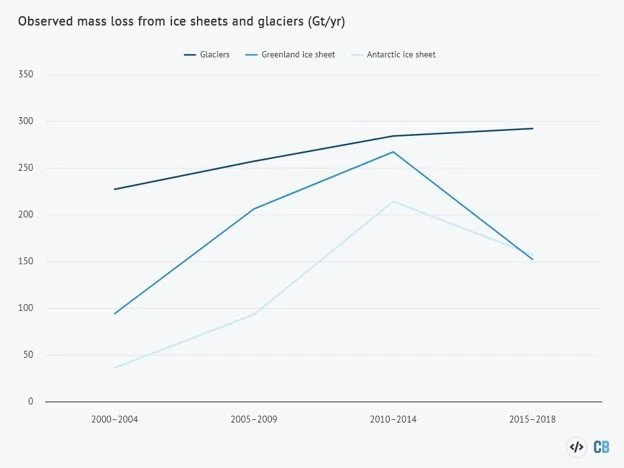
Greenland’s ice sheet holds only about 10% as much ice as Antarctica’s. We hear more about it because the Greenland ice sheet is melting at a faster rate and has contributed more to sea level rise. But the melt rate is no faster today than it was 90 years ago and has slowed over the last few years. The next figure shows the total Greenland ice sheet mass going all the way back to 1840. The increase in ice loss that began around 2000 has since reversed due to above-average winter snowfall; the historical data exhibits similar fluctuations.
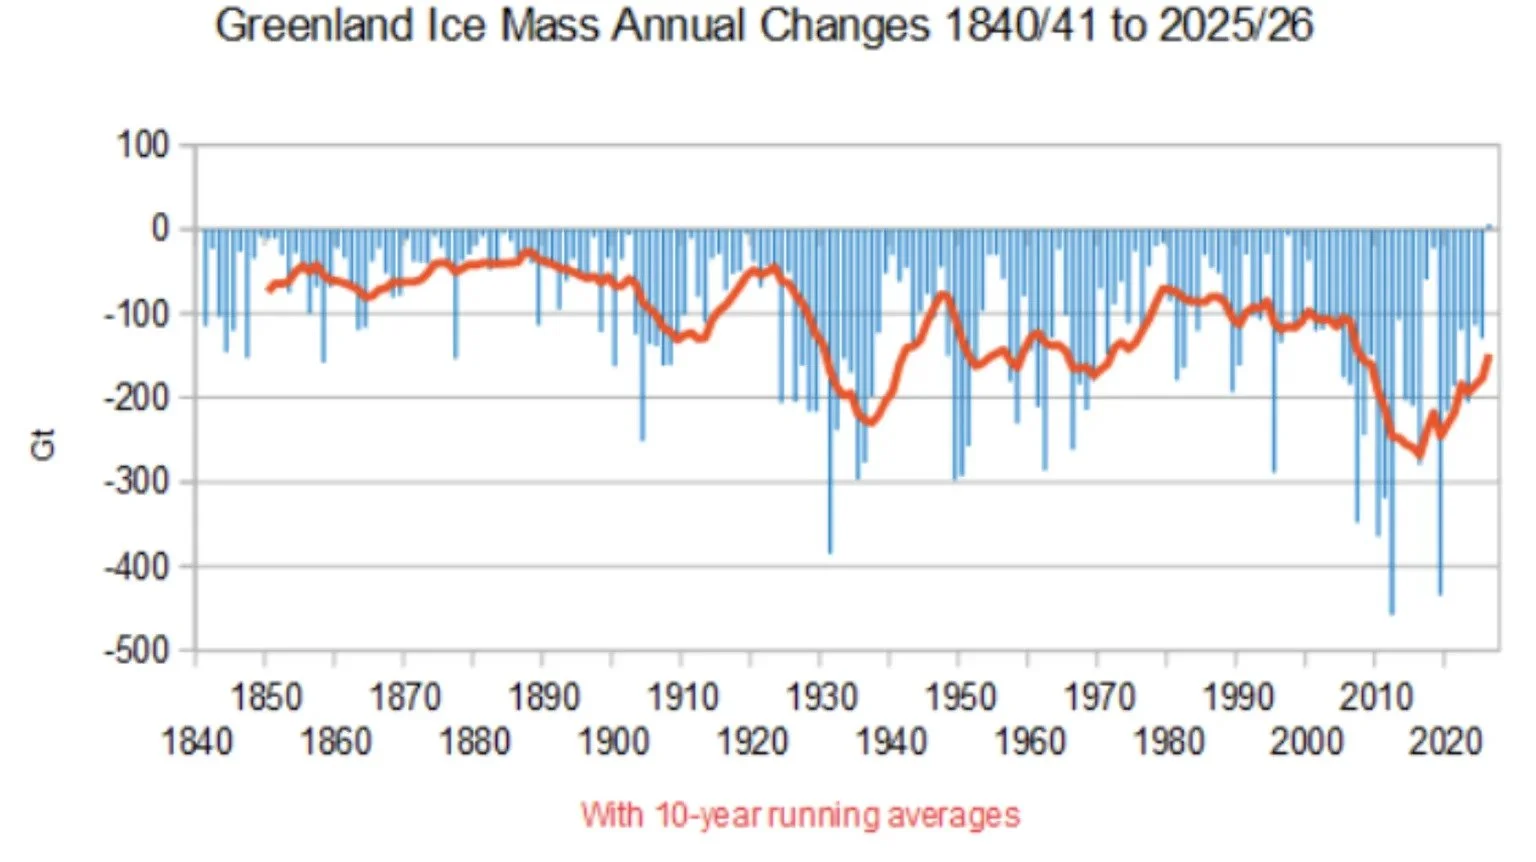
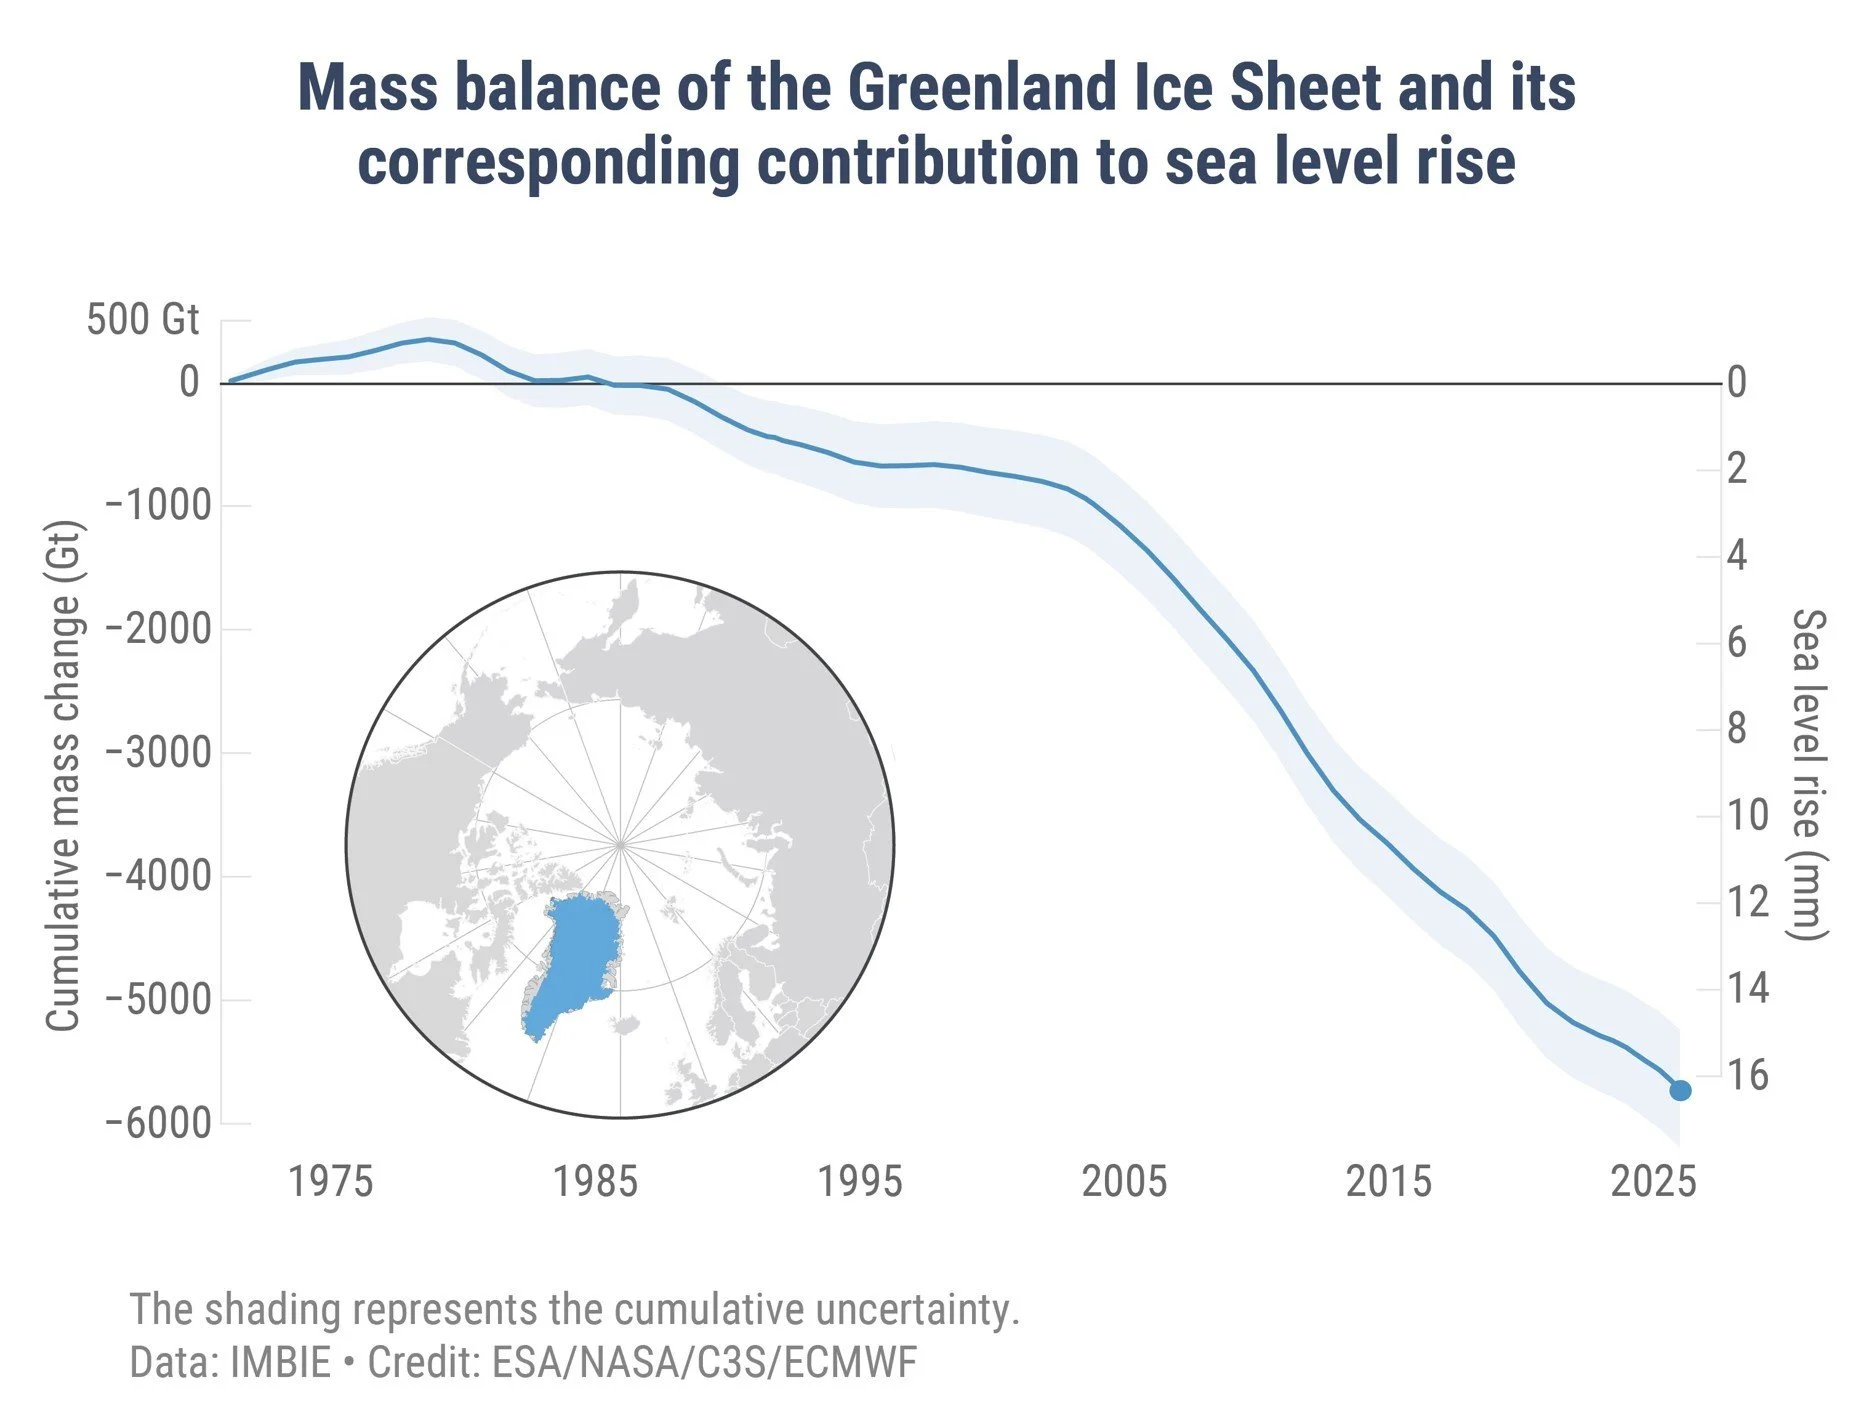
Just as with glaciers, the Greenland ice sheet started melting around 1900, long before so-called man-made global warming began. Its contribution to sea level rise is illustrated in the figure below, showing the cumulative ice mass change from 1972 to 2025. The rise in sea level over that period from melting Greenland ice averages 16/53 or 0.3 mm per year; the current rate of rise is approximately 0.4 mm per year.
The contribution of the Antarctic ice sheet to sea level rise is illustrated in the next figure, which shows the cumulative ice mass change from 1979 to 2024. The corresponding average annual rise in sea level over that period from melting Antarctic ice is 13.5/45 or 0.3 mm, the same as from Greenland’s ice sheet; again, the current rate of rise is approximately 0.4 mm per year.
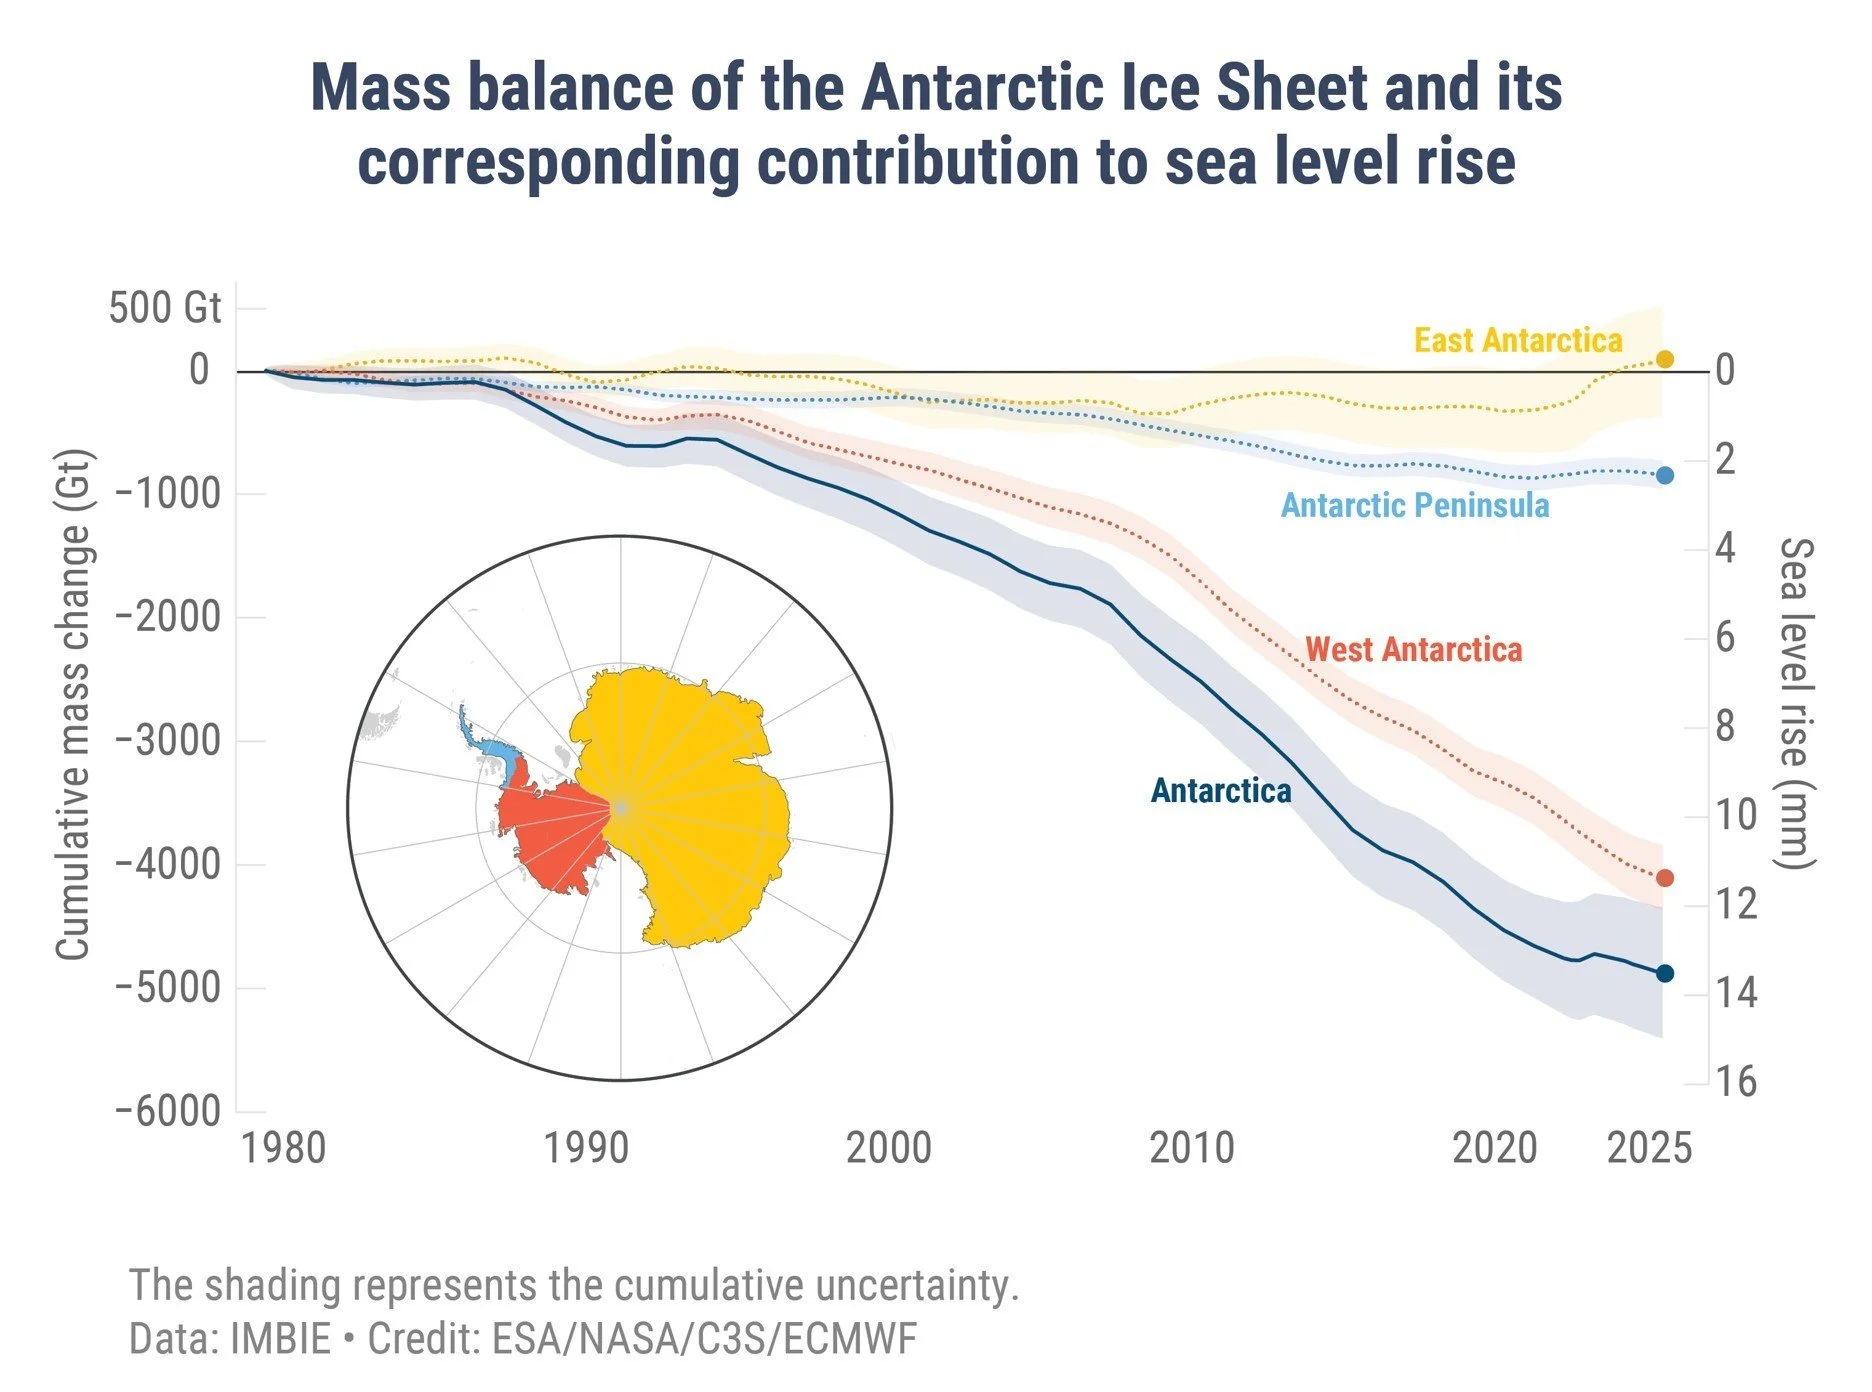
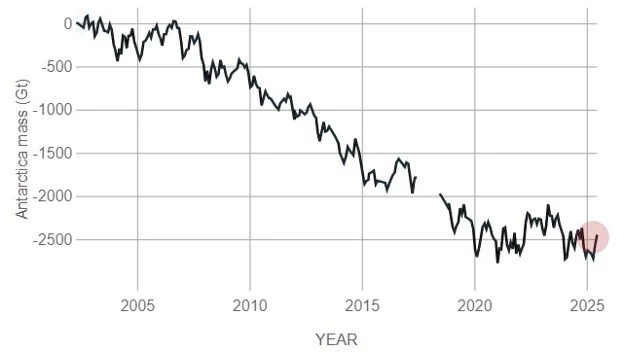
It can be seen that most Antarctic ice loss comes from West Antarctica, where melting of glaciers is significant and partly caused by active volcanoes underneath the continent. The figure below graphs changes in the total Antarctic ice sheet mass between 2002 and 2025. You can see that while the loss rate accelerated during the two decades after 2002, it appears to have stabilized since 2021.
The total contribution to sea level rise of melting ice from glaciers and ice sheets is approximately 1.8 mm per year. The remainder of the current average rise rate of 4 mm per year is due to the expansion of seawater as it warms; sinking of the seafloor under the weight of extra meltwater; and land subsidence from groundwater depletion, or rebound after melting of the last ice age’s heavy ice sheet.
Next: No Evidence That Weather Extremes Becoming More Frequent or Intense: (4) Hurricanes and Typhoons