No Evidence That Weather Extremes Becoming More Frequent or Intense: (5) Tornadoes
/Tornadoes, which occur predominantly in the U.S., are smaller and claim fewer lives than hurricanes. But they form rapidly and frequently demolish homes and buildings in their often-narrow path. Like hurricanes, tornadoes are categorized according to wind speed, using the enhanced Fujita Scale going from EF0 to EF5 (F0 to F5 before 2007); EF5 tornadoes attain wind speeds up to 480 km per hour (300 mph).
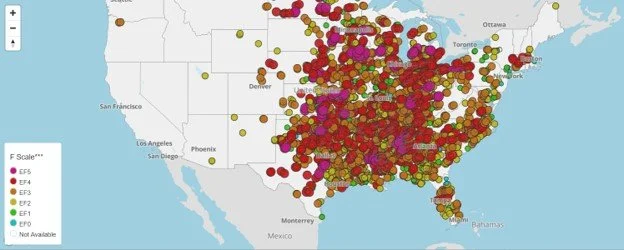
The figure below, compiled by NOAA (the U.S. National Oceanic and Atmospheric Administration), shows where all tornadoes in the U.S. from January 1, 1950 to May 31, 2026 touched down. As you can see, tornadoes cluster primarily in the eastern half of the country, especially in so-called “Tornado Alley”, an area extending northward from central Texas through the plains states.
The upper panel of the next figure shows the annual count of all EF1 or stronger tornadoes in the U.S. between 1950 and 2021, revealing no meaningful trend. This is a period that included both warming and cooling spells, with net global warming of approximately 1.0 degrees Celsius (1.8 degrees Fahrenheit) during that time. If EF0 tornadoes are included, the same plot shows an apparent increase in annual number since 1990, but that is simply due to the introduction of Doppler weather radar in the early 1990s, which led to the reporting of more tornadoes than before.
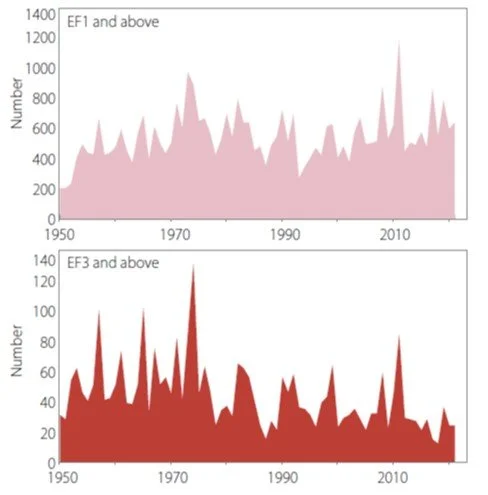
However, as seen in the lower panel, the annual number of strong U.S. tornadoes (EF3 or greater) has declined dramatically over the 72 years from 1950 to 2021. In fact, the average number of strong tornadoes annually from 1986 to 2017 was 40% less than from 1954 to 1985. Global warming, which might be expected to increase strong tornado activity, cannot have played any role.
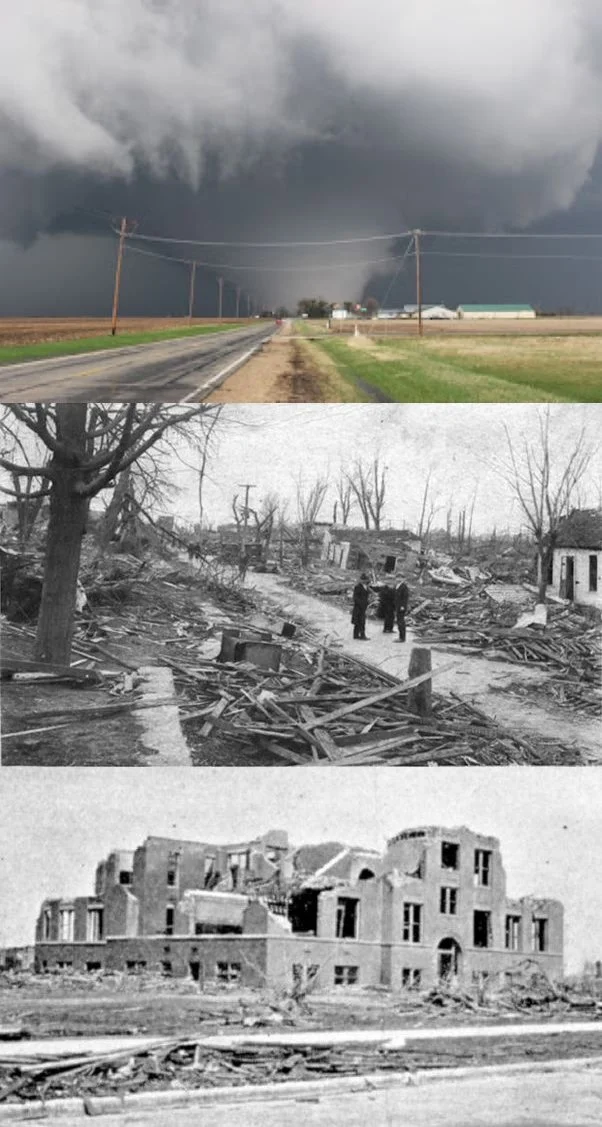
U.S. tornadoes typically cause about 80 deaths and more than 1500 injuries per year. The deadliest episode of all time in a single day was the “tri-state” outbreak in 1925, which killed over 700 people and resulted in the most damage from any tornado outbreak in U.S. history. The photo montage on the right shows one of the 12 or more tornadoes observed in Missouri, Illinois and Indiana approaching a farm (top); some of the 154 city blocks obliterated in Murphysboro, Illinois (middle); and the wreckage of Murphysboro’s Longfellow School, where 17 children were killed (bottom).
Unlike the narrow path of most tornadoes, the swath of destruction wrought by the main F5 tornado was up to 2.4 km (1.5 miles) wide. Amazingly, the ferocious storm persisted for a distance of 353 km (219 miles) in its 3 ½-hour lifetime. Together with smaller F2, F3 and F4 tornadoes, the F5 tri-state tornado destroyed or almost destroyed numerous towns. Another 33 schoolchildren died in De Soto, Illinois when their school collapsed. De Soto’s deputy sheriff was sucked into the funnel cloud, never to be seen again.
Nature’s wrath was on display once more in the most ferocious tornado outbreak ever recorded, spawning a total of 30 F4 or F5 tornadoes – the so-called Super Outbreak – in April 1974. A total of 148 tornadoes of all strengths struck 13 states in Tornado Alley and the Canadian province of Ontario over two days; their distribution and approximate path lengths are depicted in the left panel of the figure below.
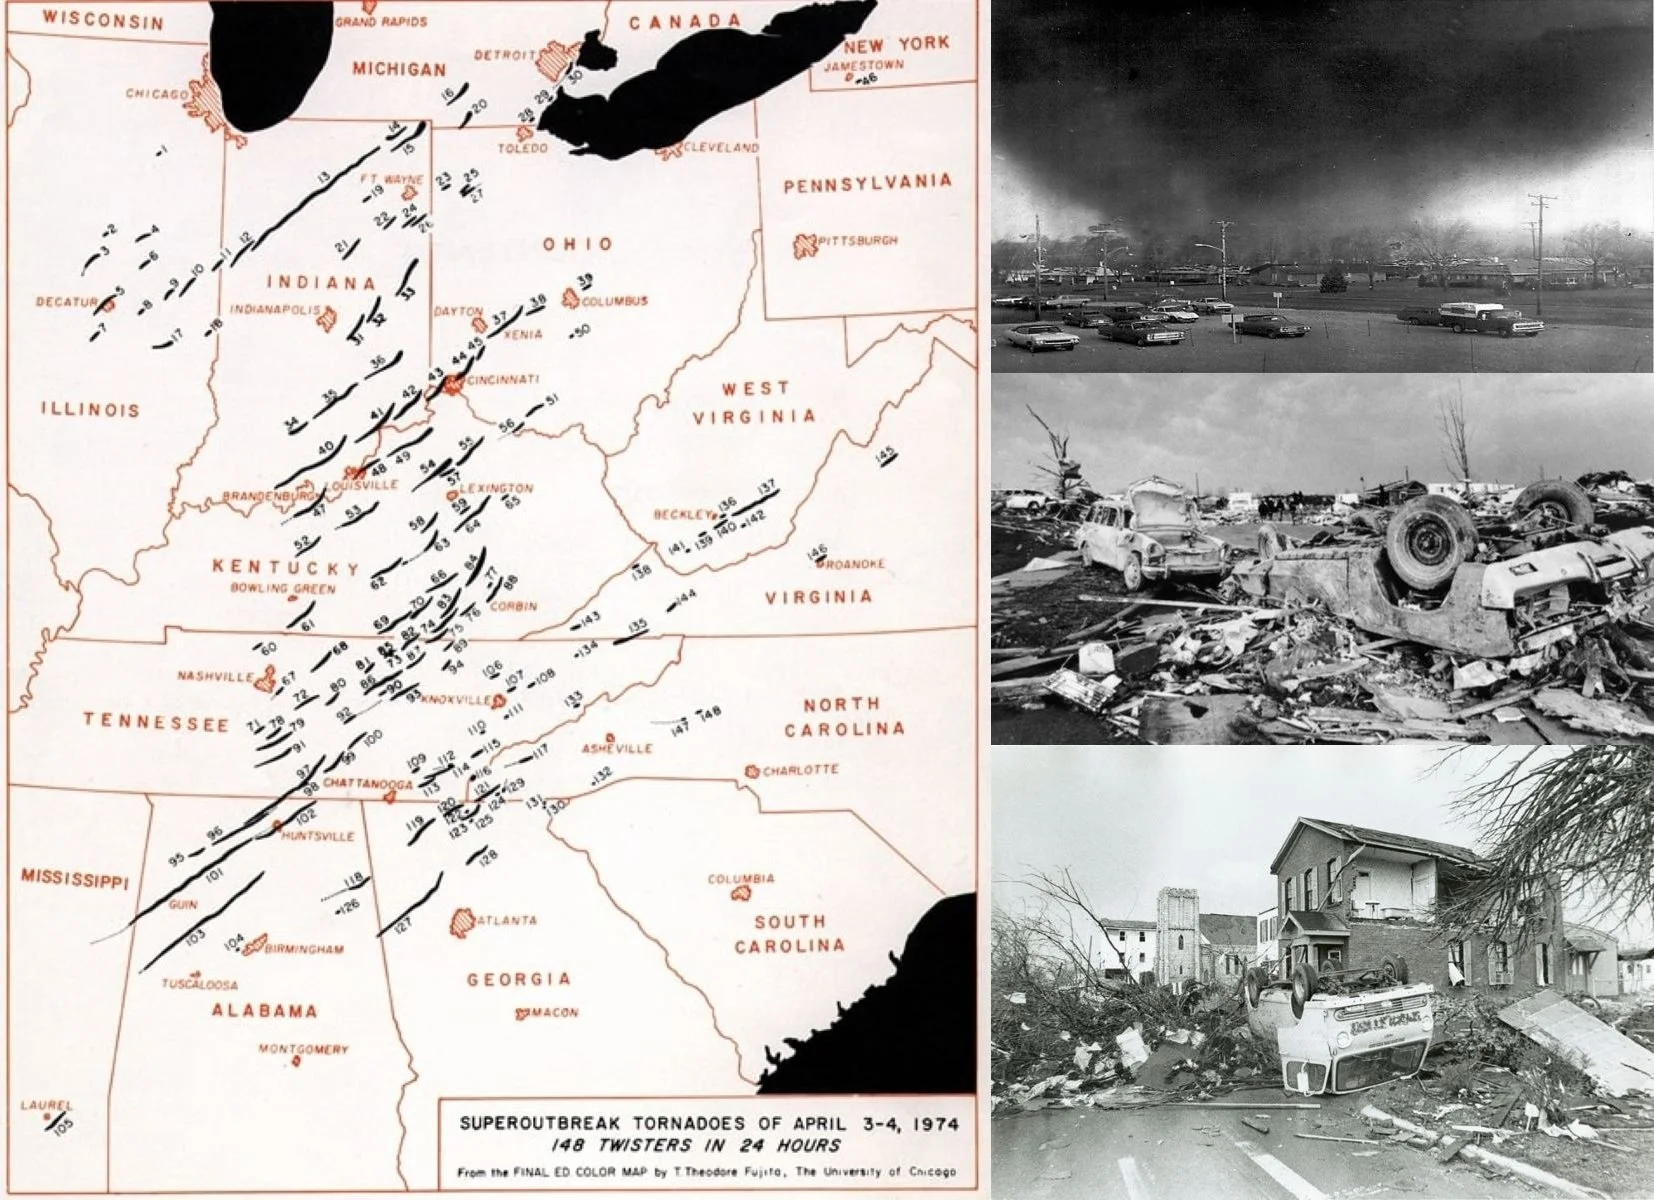
The photos on the right illustrate the massive F5 tornado, the worst of the 148, that bore down on Xenia, Ohio (population 29,000, top) and the resulting damage (middle and bottom). The Xenia tornado was so powerful that it tossed freight trains on their side and even dropped a school bus onto a stage where students had been practicing just moments before. In all, the Super Outbreak caused 335 fatalities and over 6,000 injuries.
As with hurricanes, the IPCC (Intergovernmental Panel on Climate Change) in its Sixth Assessment Report has dismissed any connection between global warming and tornadoes. While it concedes that escalating temperatures and humidity may create atmospheric instability conducive to tornadoes, it also points out that other factors governing tornado formation, such as wind shear, diminish in a warming climate.
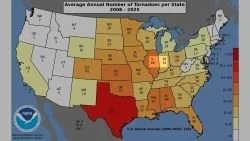
U.S. tornado activity, however, can vary drastically from year to year. The next figure depicts the average number of tornadoes per state annually from 2006 to 2025.
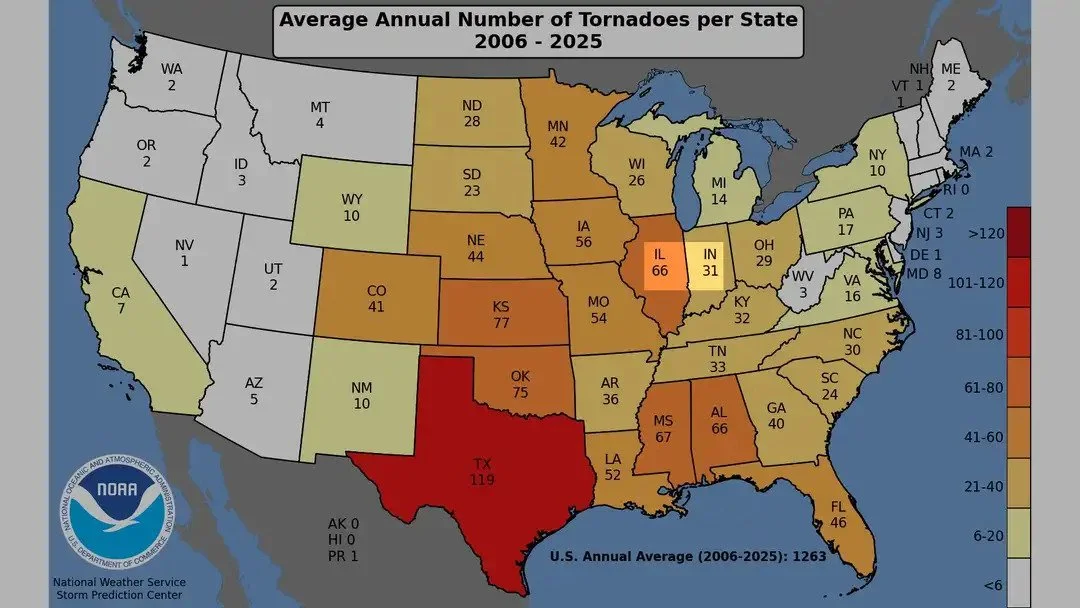
The average for Illinois, which at 66 per year is less than that for several other plains states, has already been far surpassed in 2026. By August 29, the number of confirmed tornadoes in Illinois was 210, by far the most the state has documented in any year in reliable records dating to the 1950s. The adjacent state of Indiana had also experienced a record number of tornadoes by the same date. This unusual behavior has been attributed to a sharp southward plunge of the jet stream, bringing excessive warm and humid air to the Midwest.
Next: No Evidence That Weather Extremes Becoming More Frequent or Intense: (6) Wildfires