No Evidence That Climate Change Causes Weather Extremes: (6) Heat Waves

This Northern Hemisphere summer has seen searing, supposedly record high temperatures in France and elsewhere in Europe. According to the mainstream media and climate alarmists, the heat waves are unprecedented and a harbinger of harsh, scorching hot times to come.

But this is absolute nonsense. In this sixth and final post in the present series, I’ll examine the delusional beliefs that the earth is burning up and may shortly be uninhabitable, and that this is all a result of human-caused climate change. Heat waves are no more linked to climate change than any of the other weather extremes we’ve looked at.

The brouhaha over two almost back-to-back heat waves in western Europe is a case in point. In the second, which occurred toward the end of July, the WMO (World Meteorological Organization) claimed that the mercury in Paris reached a new record high of 42.6 degrees Celsius (108.7 degrees Fahrenheit) on July 25, besting the previous record of 40.4 degrees Celsius (104.7 degrees Fahrenheit) set back in July, 1947. And a month earlier during the first heat wave, temperatures in southern France hit a purported record 46.0 degrees Celsius (114.8 degrees Fahrenheit) on June 28.

How convenient to ignore the past! Reported in Australian and New Zealand newspapers from August, 1930 is an account of an earlier French heatwave, in which the temperature soared to a staggering 50 degrees Celsius (122 degrees Fahrenheit) in the Loire valley, located in central France. That’s a full 4.0 degrees Celsius (7.2 degrees Fahrenheit) above the so-called record just mentioned in southern France, where the temperature in 1930 may well have equaled or exceeded the Loire valley’s towering record.

And the same newspaper articles reported a temperature in Paris that day of 38 degrees Celsius (100 degrees Fahrenheit), stating that back in 1870 the thermometer had reached an even higher, unspecified level there – quite possibly above the July 2019 “record” of 42.6 degrees Celsius (108.7 degrees Fahrenheit).    

The same duplicity can be seen in proclamations about past U.S. temperatures. Although it’s frequently claimed that heat waves are increasing in both intensity and frequency, there’s simply no scientific evidence for such a bold assertion. The following figure charts official data from NOAA (the U.S. National Oceanic and Atmospheric Administration) showing the yearly number of days, averaged over all U.S. temperature stations, from 1895 to 2018 with extreme temperatures above 38 degrees Celsius (100 degrees Fahrenheit) and 41 degrees Celsius (105 degrees Fahrenheit).

ac-rebuttal-heat-waves-081819.jpg

The next figure shows NOAA’s data for the year in which the record high temperature in each U.S. state occurred. Of the 50 state records, a total of 32 were set in the 1930s or earlier, but only seven since 1990.

US high temperature records.jpg

It’s obvious from these two figures that there were more U.S. heat waves in the 1930s, and they were hotter, than in the present era of climate hysteria. Indeed, the annual number of days on which U.S. temperatures reached 100 degrees, 95 degrees or 90 degrees Fahrenheit has been steadily falling since the 1930s. The EPA (Environmental Protection Agency)’s Heat Wave Index for the 48 contiguous states also shows clearly that the 1930s were the hottest decade.

Globally, it’s exactly the same story, as depicted in the figure below.

World record high temperatures 500.jpg

Of the seven continents, six recorded their all-time record high temperatures before 1982, three records dating from the 1930s or before; only Asia has set a record more recently (the WMO hasn’t acknowledged the 122 degrees Fahrenheit 1930 record in the Loire region). And yet the worldwide baking of the 1930s didn’t set the stage for more and worse heat waves in the years ahead, even as CO2 kept pouring into the atmosphere – the scenario we’re told, erroneously, that we face today. In fact, the sweltering 1930s were followed by global cooling from 1940 to 1970.

Contrary to the climate change narrative, the recent European heat waves came about not because of global warming, but rather a weather phenomenon known as jet stream blocking. Blocking results from an entirely different mechanism than the buildup of atmospheric CO2, namely a weakening of the sun’s output that may portend a period of global cooling ahead. A less active sun generates less UV radiation, which in turn perturbs winds in the upper atmosphere, locking the jet stream in a holding or blocking pattern. In this case, blocking kept a surge of hot Sahara air in place over Europe for extended periods.

It should be clear from all the evidence presented above that mass hysteria over heat waves and climate change is completely unwarranted. Current heat waves have as little to do with global warming as floods, droughts, hurricanes, tornadoes and wildfires.

Next: No Evidence That Heat Kills More People than Cold

No Evidence That Climate Change Causes Weather Extremes: (5) Wildfires

Probably the most fearsome of the weather extremes commonly blamed on human-caused climate change are tornadoes – the previous topic in this series – and wildfires. Both can arrive with little or no warning, making it difficult or impossible to flee, are often deadly, and typically destroy hundreds of homes and other structures. But just like tornadoes, there is no scientific evidence that the frequency or severity of wildfires are on the rise in a warming world.

You wouldn’t know that, however, from the mass hysteria generated by the mainstream media and climate activists almost every time a wildfire breaks out, especially in naturally dry climates such as those in California, Australia or Spain. While it’s true that the number of acres burned annually in the U.S. has gone up over the last 20 years or so, the present burned area is still only a small fraction of what it was back in the record 1930s, as seen in the figure below, showing data compiled by the U.S. National Interagency Fire Center.

Wildfires US-acres-burned 1926-2017 copy.jpg

Because modern global warming was barely underway in the 1930s, climate change clearly has nothing to do with the incineration of U.S. forests. Exactly the same trend is apparent in the next figure, which depicts the estimated area worldwide burned by wildfires, by decade from 1900 to 2010. Clearly, wildfires have diminished globally as the planet has warmed.

Global Burned Area

1900-2010

Wildfires global-acres-burned JPG.jpg

In the Mediterranean, although the annual number of wildfires has more than doubled since 1980, the burned area over three decades has mimicked the global trend and declined:

Mediterranean Wildfire Occurrence & Burnt Area

1980-2010

Wildfires Mediterranean_number_and_area 1980-2010 copy.jpg

The contrast between the Mediterranean and the U.S., where wildfires are becoming fewer but larger in area, has been attributed to different forest management policies on the two sides of the Atlantic – despite the protestations of U.S. politicians and firefighting officials in western states that climate change is responsible for the uptick in fire size. The next figure illustrates the timeline from 1600 onwards of fire occurrence at more than 800 different sites in western North America. 

Western North America Wildfire Occurrence

1600-2000

Western North American wildfires JPG.jpg

The sudden drop in wildfire occurrence around 1880 has been ascribed to the expansion of American livestock grazing in order to feed a rapidly growing population. Intensive sheep and cattle grazing after that time consumed most of the grasses that previously constituted the fuel for wildfires. This depletion of fuel, together with the firebreaks created by the constant movement of herds back and forth to water sources, and by the arrival of railroads, drastically reduced the incidence of wildfires. And once mechanical equipment for firefighting such as fire engines and aircraft became available in the 20th century, more and more emphasis was placed on wildfire prevention.

But wildfire suppression in the U.S. has led to considerable increases in forest density and the buildup of undergrowth, both of which greatly enhance the potential for bigger and sometimes hotter fires – the latter characterized by a growing number of terrifying, superhot “firenadoes” or fire whirls occasionally observed in today’s wildfires.

Intentional burning, long used by native tribes and early settlers and even advocated by some environmentalists who point out that fire is in fact a natural part of forest ecology as seen in the preceding figure, has become a thing of the past. Only now, after several devastating wildfires in California, is the idea of controlled burning being revived in the U.S. In Europe, on the other hand, prescribed burning has been supported by land managers for many years.

Combined with overgrowth, global warming does play a role by drying out vegetation and forests more rapidly than before. But there’s no evidence at all for the notion peddled by the media that climate change has amplified the impact of fires on the ecosystem, known technically as fire severity. Indeed, at least 10 published studies of forest fires in the western U.S. have found no recent trend in increasing fire severity.

You may think that the ever-rising level of CO2 in the atmosphere would exacerbate wildfire risk, since CO2 promotes plant growth. But at the same time, higher CO2​ levels reduce plant transpiration, meaning that plants’ stomata or breathing pores open less, the leaves lose less water and more moisture is retained in the soil. Increased soil moisture has led to a worldwide greening of the planet.

In summary, the mistaken belief that the “new normal” of devastating wildfires around the globe is a result of climate change is not supported by the evidence. Humans, nevertheless, are the primary reason that wildfires have become larger and more destructive today. Population growth has caused more people to build in fire-prone areas, where fires are frequently sparked by an aging network of power lines and other electrical equipment. Coupled with poor forest management, this constitutes a recipe for disaster.

Next: No Evidence That Climate Change Causes Weather Extremes: (6) Heat Waves

No Evidence That Climate Change Causes Weather Extremes: (4) Tornadoes

tornadoes.jpg

Tornadoes are smaller and claim fewer lives than hurricanes. But the roaring twisters can be more terrifying because of their rapid formation and their ability to hurl objects such as cars, structural debris, animals and even people through the air. Nonetheless, the narrative that climate change is producing stronger and more deadly tornadoes is as fallacious as the nonexistent links between climate change and other weather extremes previously examined in this series.

Again, the UN’s IPCC (Intergovernmental Panel on Climate Change), whose assessment reports constitute the bible for the climate science community, has dismissed any connection between global warming and tornadoes. While the agency concedes that escalating temperatures and humidity may create atmospheric instability conducive to tornadoes, it also points out that other factors governing tornado formation, such as wind shear, diminish in a warming climate. In fact, declares the IPCC, the apparent increasing trend in tornadoes simply reflects their reporting by a larger number of people now living in remote areas.

A tornado is a rapidly rotating column of air, usually visible as a funnel cloud, that extends like a dagger from a parent thunderstorm to the ground. Demolishing homes and buildings in its often narrow path, it can travel many kilometers before dissipating. The most violent EF5 tornadoes attain wind speeds up to 480 km per hour (300 mph).

The U.S. endures by far the most tornadoes of any country, mostly in so-called Tornado Alley extending northward from central Texas through the Plains states. The annual incidence of all U.S. tornadoes from 1954 to 2017 is shown in the figure below. It’s obvious that no trend exists over a period that included both cooling and warming spells, with net global warming of approximately 1.1 degrees Celsius (2.0 degrees Fahrenheit) during that time.

US Tornadoes (NOAA) 1954-2017.jpg

But, as an illustration of how U.S. tornado activity can vary drastically from year to year, 13 successive days of tornado outbreaks in 2019 saw well over 400 tornadoes touch down in May, with June a close second – and this following seven quiet years ending in 2018, which was the quietest year in the entire record since 1954. The tornado surge, however, had nothing to do with climate change, but rather an unusually cold winter and spring in the West that, combined with heat from the Southeast and late rains, provided the ingredients for severe thunderstorms. 

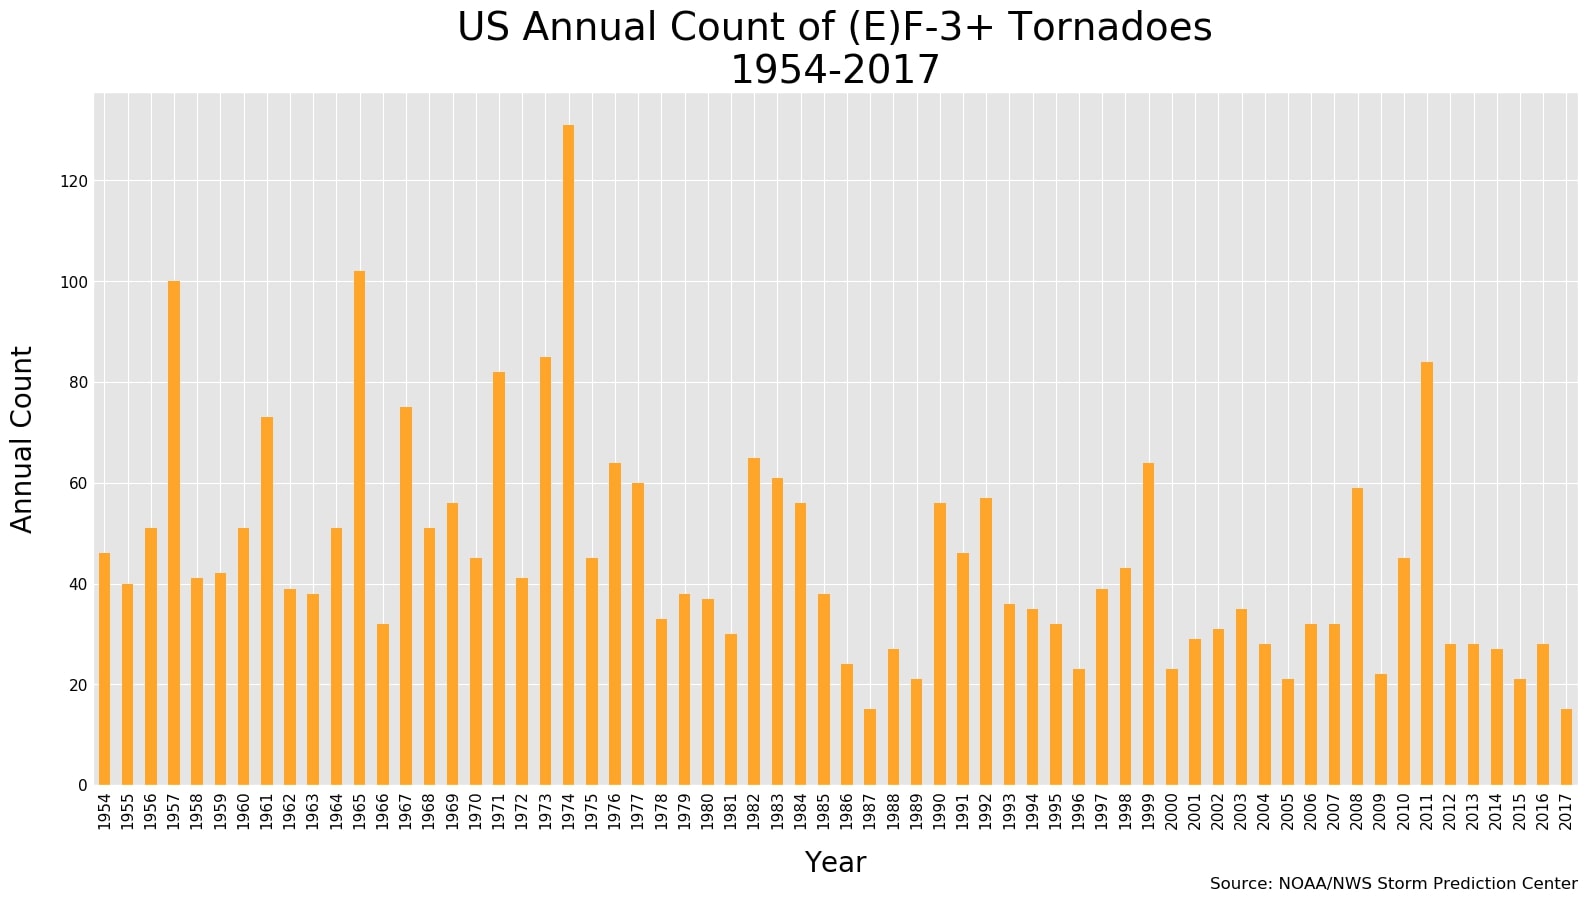
The next figure depicts the number of strong (EF3 or greater) tornadoes observed in the U.S. each year during the same period from 1954 to 2017. Clearly, the trend is downward instead of upward; the average number of strong tornadoes annually from 1986 to 2017 was 40% less than from 1954 to 1985. Once more, global warming cannot have played a role. 

US strong tornadoes (NOAA) 1954-2017.jpg

In the U.S., tornadoes cause about 80 deaths and more than 1,500 injuries per year. The deadliest episode of all time in a single day was the “tri-State” outbreak in 1925, which killed 747 people and resulted in the most damage from any tornado outbreak in U.S. history. The most ferocious tornado outbreak ever recorded, spawning a total of 30 EF4 or EF5 tornadoes, was in 1974.

Tornadoes also occur more rarely in other parts of the world such as South America and Europe. The earliest known tornado in history occurred in Ireland in 1054. The human toll from tornadoes in Bangladesh actually exceeds that in the U.S., at an estimated 179 deaths per year, partly due to the region’s high population density. It’s population growth and expansion outside urban areas that have caused the cost of property damage from tornadoes to mushroom in the last few decades, especially in the U.S.

Next: No Evidence That Climate Change Causes Weather Extremes: (5) Wildfires

No Evidence That Climate Change Causes Weather Extremes: (3) Hurricanes

This third post in our series on the spurious links between climate change and extreme weather examines the incidence of hurricanes – powerful tropical cyclones that all too dramatically demonstrate the fury nature is capable of unleashing.

Although the UN’s IPCC (Intergovernmental Panel on Climate Change) has noted an apparent increase in the strongest (Category 4 and 5) hurricanes in the Atlantic Ocean, there’s almost no evidence for any global trend in hurricane strength. And the IPCC has found “no significant observed trends” in the number of global hurricanes each year.

Hurricanes occur in the Atlantic and northeastern Pacific Oceans, especially in and around the Gulf of Mexico; their cousins, typhoons, occur in the northwestern Pacific. Hurricanes can be hundreds of miles in extent with wind speeds up to 240 km per hour (150 mph) or more, and often exact a heavy toll in human lives and personal property. The deadliest U.S. hurricane in recorded history struck Galveston, Texas in 1900, killing an estimated 8,000 to 12,000 people. In the Caribbean, the Great Hurricane of 1780 killed 27,500 and winds exceeded an estimated 320 km per hour (200 mph). The worst hurricanes and typhoons worldwide have each claimed hundreds of thousands of lives.

How often hurricanes have occurred globally since 1981 is depicted in the figure below.

Hurricane frequency global (Ryan Maue).jpg

You can see immediately that the annual number of hurricanes overall (upper graph) is dropping. But, while the number of major hurricanes of Category 2, 3, 4 or 5 strength (lower graph) seems to show a slight increase over this period, the trend has been ascribed to improvements in observational capabilities, rather than warming oceans that provide the fuel for tropical cyclones.

The lack of any trend in major global hurricanes is borne out by the number of Category 3, 4 or 5 global hurricanes that make landfall, illustrated in the next figure. 

Hurricanes - global landfalls 1970-2018.png

It’s clear that the frequency of landfalling hurricanes of any strength (Categories 1 through 5) hasn’t changed in the nearly 50 years since 1970 – during a time when the globe warmed by approximately 0.6 degrees Celsius (1.1 degrees Fahrenheit). So the strongest hurricanes today aren’t any more extreme or devastating than those in the past. If anything, major landfalling hurricanes in the U.S. are tied to La Niña cycles in the Pacific Ocean, not to global warming.

Data for the North Atlantic basin, which has the best quality data available in the world, do, however, show heightened hurricane activity over the last 20 years. The figure below illustrates the frequency of all North Atlantic hurricanes (top graph) and major hurricanes (bottom graph) for the much longer period from 1851 to 2018.

Hurricanes - North Atlantic & major 1850-2020.png

What the data reveals is that the annual number of major North Atlantic hurricanes during the 1950s and 1960s was at least comparable to that during the last two decades when, as can be seen, the number took a sudden upward hike from the 1970s, 1980s and 1990s. But, because the earth was cooling in the 1950s and 1960s, the present enhanced hurricane activity in the North Atlantic is highly unlikely to result from global warming.

Even though it appears from the figure that major North Atlantic hurricanes were less frequent before about 1940, the lower numbers simply reflect the relative lack of observations in early years of the record. Aircraft reconnaissance flights to gather data on hurricanes didn’t begin until 1944, while satellite coverage dates from only 1966. While the data shown in the figure above has been adjusted to compensate for these deficiencies, it’s probable that the number of major North Atlantic hurricanes before 1944 is still undercounted.

The true picture is much more complicated, and any explanation of changing hurricane behavior needs to account as well for other factors, such as the now more rapid intensification of these violent storms and their slower tracking than before, both of which result in heavier rain following landfall.

The short duration of the observational record, and the even shorter record from the satellite era, makes it impossible to assess whether recent hurricane activity is unusual for the present interglacial period. Paleogeological studies of sediments in North Atlantic coastal waters suggest that the current boosted hurricane activity is not at all unusual, with several periods of frequent intense hurricane strikes having occurred thousands of years ago.

Next: No Evidence That Climate Change Causes Weather Extremes: (4) Tornadoes

No Evidence That Climate Change Causes Weather Extremes: (2) Floods

Widespread flooding and devastating tornadoes in the U.S. Midwest this May only served to amplify the strident voices of those who claim that climate change has intensified the occurrence of major floods, droughts, hurricanes, heat waves and wildfires. Like-minded voices in other countries have also fallen into the same trap of linking weather extremes to global warming.  

Apart from the IPCC (Intergovernmental Panel on Climate Change)’s dismissal of such hysterical beliefs, an increasing number of research studies are helping to dispel the notion that a warmer world is necessarily accompanied by more severe weather.

A 2017 Australian study of global flood risk concluded very little evidence exists that worldwide flooding is becoming more prevalent. Despite average rainfall getting heavier as the planet warms, the study authors point out that excessive precipitation is not the only cause of flooding. What is less obvious is that alterations to the catchment area – such as land-use changes, deforestation and the building of dams – also play a major role. 

Yet the study found that the biggest influence on flood trends is not more intense precipitation, changes in forest cover or the presence of dams, but the size of the catchment area. Previous studies had emphasized small catchment areas, as these were thought less likely to have been extensively modified. However, the new study discovered that, while smaller catchments do show a trend in flood risk that’s increasing over time, larger catchments exhibit a decreasing trend.

Globally, larger catchments dominate, so the trend in flood risk is actually decreasing rather than increasing in most parts of the globe, if there’s any trend at all. This is illustrated in the figure below, the data coming from 1,907 different locations over the 40 years from 1966 to 2005. Additional data from other locations and for a longer (93-year) period show the same global trend.

Flood1.jpg

But while the overall trend is decreasing, the local trend in regions where smaller catchments are more common, such as Europe, eastern North America and southern Africa, is toward more flooding. The study authors suggest that the lower flood trend in larger catchment areas is due to the expanding presence of agriculture and urbanization.

Another 2017 study, this time restricted to North America and Europe, found “no compelling evidence for consistent changes over time” in the occurrence of major floods from 1930 to 2010. Like the first study described above, this research included both small and large catchment areas. But the only catchments studied were those with minimal alterations and less than 10% urbanization, so as to focus on any trends driven by climate change.

The second figure below shows the likelihood of a 100-year flood occurring in North America or Europe in any given year, during two slightly different periods toward the end of the 20th century. A 100-year flood is a massive flood that occurs on average only once a century, and has a 1 in 100 or 1% chance of occurring or being exceeded in any given year – although the actual interval between 100-year floods is often less than 100 years.

Flood2.jpg
Flood3.jpg

You can see that for both periods studied, the probability of a 100-year flood in North America or Europe hovers around the 1% (0.01) level or below, implying that 100-year floods were no more or less likely to occur during those intervals than at any time. The straight lines drawn through the data points are meaningless. Similar results were obtained for 50-year floods. 

Although the international study authors concluded that major floods in the Northern Hemisphere between 1931 and 2010 weren’t caused by global warming and were no more likely than expected from chance alone, they did find that floods were influenced by the climate. The strongest influence is the naturally occurring Atlantic Multidecadal Oscillation, an ocean cycle that causes heavier than normal rainfall in Europe and lighter rainfall in North America during its positive phase – leading to an increase in major European floods and a decrease in North American ones.

The illusion that major floods are becoming more common is due in part to the world’s growing population and the appeal, in the more developed countries at least, of living near water. This has led to people building their dream homes in harm’s way on river or coastal floodplains, where rainfall-swollen rivers or storm surges result in intermittent flooding and subsequent devastation. It’s changing human wants rather than climate change that are responsible for disastrous floods.

Next: No Evidence That Climate Change Causes Weather Extremes: (3) Hurricanes

No Evidence That Climate Change Causes Weather Extremes: (1) Drought

Weather extremes are a commonly cited line of evidence for human-caused climate change. Despite the UN’s IPCC (Intergovernmental Panel on Climate Change) having found little to no evidence that global warming triggers extreme weather, the mainstream media and more than a few climate scientists don’t hesitate to trumpet their beliefs to the contrary at every opportunity.

In this and subsequent blog posts, I’ll show how the quasi-religious belief linking extreme weather events to climate change is badly mistaken and at odds with the actual scientific record. We’ll start with drought.

Droughts have been a continuing feature of the earth’s climate for millennia. Although generally caused by a severe fall-off in precipitation, droughts can be aggravated by other factors such as elevated temperatures, soil erosion and overuse of available groundwater. The consequences of drought, which can be catastrophic for human and animal life, include crop failure, starvation and mass migration. A major exodus of early humans out of Africa about 135,000 years ago is thought to have been driven by drought.  

Getting a good handle on drought has only been possible since the end of the 19th century, when the instrumentation needed to measure extreme weather accurately was first developed. The most widely used gauge of dry conditions is the Palmer Drought Severity Index that measures both dryness and wetness and classifies them as “moderate”, “severe” or “extreme.” The figure below depicts the Palmer Index for the U.S. during the past century or so, for all three drought or wetness classifications combined.

US drought index 1900-2012 JPG.jpg

What jumps out immediately is the lack of any long-term trend in either dryness or wetness in the U.S. With the exception of the 1930s Dust Bowl years, the pattern of drought (upper graph) looks boringly similar over the entire 112-year period, as does the pattern of excessive rain (lower graph).

Much the same is true for the rest of the world. The next figure illustrates two different drought indices during the period 1910-2010 for India, a country subject to parching summer heat followed by drenching monsoonal rains; negative values denote drought and positive values wetness. The two indices are a version of the Palmer Drought Severity Index (sc-PDSI, top graph), and the Standardized Precipitation Index (SPI, bottom graph). The SPI, which relies on rainfall data only, is easier to calculate than the PDSI, which depends on both rainfall and temperature. While both indices are useful, the SPI is better suited to making comparisons between different regions.

India Drought Index

1910-2010

SPEI index India JPG TOP.jpg
SPEI index India JPG BOTTOM.jpg

You’ll see that the SPI in India shows no particular tendency over the 100-year period toward either dryness or wetness, though there are 20-year intervals exhibiting one of the two conditions; the apparent trend of the PDSI toward drought since 1990 is an artifact of the index. Similar records for other countries around the globe all show the same thing – no drying of the planet as a whole over more than 100 years.

Recently, the mainstream media created false alarm over drought by mindlessly broadcasting the results of a new study, purporting to demonstrate that global warming will soon result in “unprecedented drying.” By combining computer models with long-term observations, the study authors claim to have definitively connected global warming to drought.

But this claim doesn’t hold up, even in the study’s results. Although the authors were able to match warming to drought conditions during the first half of the 20th century, their efforts were a dismal failure after that. From 1950 to 1980, the “fingerprint” of human-caused global warming completely disappeared, in spite of ever-increasing CO2 in the atmosphere. And from 1981 onward, the fingerprint was so faint that it couldn’t be distinguished from background noise. So the assertion by the authors that global warming causes drought is nothing but wishful thinking.

As further evidence that climate change isn’t exacerbating drought, the final figure below shows the Palmer Index for the U.S. since 1996. Just like the record for the period from 1900 up to 2012 illustrated in the first figure above, there is no discernible trend in either dryness or wetness. While the West and Southwest have both experienced lengthy spells of drought during this period, extreme dry conditions now appear to have abated in both Texas and California.

US drought index 1996-2018 JPG.jpg

In summary, the scientific evidence simply doesn’t support any link between drought and climate change. The IPCC was right to express low confidence in any global-scale observed trend.

Next: No Evidence That Climate Change Causes Weather Extremes: (2) Floods

Science, Political Correctness and the Great Barrier Reef

A recent Australian court case highlights the intrusion of political correctness into science to bolster the climate change narrative. On April 16, a federal judge ruled that Australian coral scientist Dr. Peter Ridd had been unlawfully fired from his position at North Queensland’s James Cook University, for questioning his colleagues’ research on the impact of climate change on the Great Barrier Reef. In his ruling, the judge criticized the university for not respecting Ridd’s academic freedom.

Great Barrier Reef.jpg

The Great Barrier Reef is the world's largest coral reef system, 2,300 km (1,400 miles) long and visible from outer space. Labeled by CNN as one of the seven natural wonders of the world, the reef is a constant delight to tourists, who can view the colorful corals from a glass-bottomed boat or by snorkeling or scuba diving.

Rising temperatures, especially during the prolonged El Niño of 2014-17, have severely damaged portions of the Great Barrier Reef – so much so that the reef has become the poster child for global warming. Corals are susceptible to overheating and undergo bleaching when the water gets too hot, losing their vibrant colors. But exactly how much of the Great Barrier Reef has been affected, and how quickly it’s likely to recover, are controversial issues among reef researchers.

Ridd’s downfall came after he authored a chapter on the resilience of Great Barrier Reef corals in the book, Climate Change: The Facts 2017. In his chapter and subsequent TV interviews, Ridd bucked the politically correct view that the reef is doomed to an imminent death by climate change, and criticized the work of colleagues at the university’s Centre of Excellence for Coral Reef Studies. He maintained that his colleagues’ findings on the health of the reef in a warming climate were flawed, and that scientific organizations such as the Centre of Excellence could no longer be trusted.

Ridd had previously been censured by the university for going public with a dispute over a different aspect of reef health. This time, his employer accused Ridd of “uncollegial” academic misconduct and warned him to remain silent about the charge. When he didn’t, the university fired him after a successful career of more than 40 years.

At the crux of the issue of bleaching is whether or not it’s a new phenomenon. The politically correct view of many of Ridd’s fellow reef scientists is that bleaching didn’t start until the 1980s as global warming surged, so is an entirely man-made spectacle. But Ridd points to scientific records that reveal multiple coral bleaching events around the globe throughout the 20th century.

The fired scientist also disagrees with his colleagues over the extent of bleaching from the massive 2014-17 El Niño. Ridd estimates that just 8% of Great Barrier Reef coral actually died; much of the southern end of the reef didn’t suffer at all. But his politically correct peers maintain that the die-off was anywhere from 30% to 95%.

Such high estimates, however, are for very shallow water coral – less than 2 meters (7 feet) below the surface, which is only a small fraction of all the coral in the reef. A recent independent study found that deep water coral – down to depths of more than 40 meters (130 feet) – saw far less bleaching. And while Ridd’s critics claim that warming has reduced the growth rate of new coral by 15%, he finds that the growth rate has increased slightly over the past 100 years.

Ridd explains the adaptability of corals to heating as a survival mechanism, in which the multitude of polyps that constitute a coral exchange the microscopic algae that normally live inside the polyps and give coral its striking colors. Hotter than normal water causes the algae to poison the coral that then expels them, turning the polyps white. But to survive, the coral needs resident algae which supply it with energy by photosynthesis of sunlight. So from the surrounding water, the coral selects a different species of algae better suited to hot conditions, a process that enables the coral to recover within a few years, says Ridd.

Ridd attributes what he believes are the erroneous conclusions of his reef scientist colleagues to a failure of the peer review process in scrutinizing their work. To support his argument, he cites the so-called reproducibility crisis in contemporary science – the vast number of peer-reviewed studies that can’t be replicated in subsequent investigations and whose findings turn out to be false. Although it’s not known how severe irreproducibility is in climate science, it’s a serious problem in the biomedical sciences, where as many as 89% of published results in certain fields can’t be reproduced.

In Ridd’s opinion, as well as mine, studies predicting that the Great Barrier Reef is in imminent peril are based more on political correctness than good science.

Next: UN Species Extinction Report Spouts Unscientific Hype, Dubious Math

Does Climate Change Threaten National Security?

Earth new.jpg

The U.S. White House’s proposed Presidential Committee on Climate Security (PCCS) is under attack – by the mainstream media, Democrats in Congress and military retirees, among others. The committee’s intended purpose is to conduct a genuine scientific assessment of climate change.

But the assailants’ claim that the PCCS is a politically motivated attempt to overthrow science has it backwards. The Presidential Committee will undertake a scientifically motivated review of climate change science, in the hope of eliminating the subversive politics that have taken over the scientific debate.

It’s those opposed to the committee who are playing politics and abusing science. The whole political narrative about greenhouse gases and dangerous anthropogenic (human-caused) warming, including the misguided Paris Agreement that the U.S. has withdrawn from, depends on faulty computer climate models that failed to predict the recent slowdown in global warming, among other shortcomings. The actual empirical evidence for a substantial human contribution to global warming is flimsy.

And the supposed 97% consensus among climate scientists that global warming is largely man-made is a gross exaggeration, mindlessly repeated by politicians and the media.

The 97% number comes primarily from a study of approximately 12,000 abstracts of research papers on climate science over a 20-year period. What is rarely revealed is that nearly 8,000 of the abstracts expressed no opinion at all on human-caused warming. When that and a subsidiary survey are taken into account, the climate scientist consensus percentage falls to between 33% and 63% only. So much for an overwhelming majority! 

Blatant exaggeration like this for political purposes is all too common in climate science. An example that permeates current news articles and official reports on climate change is the hysteria over extreme weather. Almost every hurricane, major flood, drought, wildfire or heat wave is ascribed to global warming.

But careful examination of the actual scientific data shows that if there’s a trend in any of these events, it’s downward rather than upward. Even the UN’s Intergovernmental Panel on Climate Change has found little to no evidence that global warming increases the occurrence of many types of extreme weather.

Polar bear JPG 250.jpg

Another over-hyped assertion about climate change is that the polar bear population at the North Pole is shrinking because of diminishing sea ice in the Arctic, and that the bears are facing extinction. Yet, despite numerous articles in the media and photos of apparently starving bears, current evidence shows that the polar bear population has actually been steady for the whole period that the ice has been decreasing and may even be growing, according to the native Inuit.

All these exaggerations falsely bolster the case for taking immediate action to combat climate change, supposedly by pulling back on fossil fuel use. But the mandate of the PCCS is to cut through the hype and assess just what the science actually says.  

A specific PCCS goal is to examine whether climate change impacts U.S. national security, a connection that the defense and national security agencies have strongly endorsed.

A recent letter of protest to the President from a group of former military and civilian national security professionals expresses their deep concern about “second-guessing the scientific sources used to assess the threat … posed by climate change.” The PCCS will re-evaluate the criteria employed by the national agencies to link national security to climate change.

The protest letter also claims that less than 0.2% of peer-reviewed climate science papers dispute that climate change is driven by humans. This is nonsense. In solar science alone during the first half of 2017, the number of peer-reviewed papers affirming a strong link between the sun and our climate, independent of human activity, represented approximately 4% of all climate science papers during that time – and there are many other fields of study apart from the sun.

Let’s hope that formation of the new committee will not be thwarted and that it will uncover other truths about climate science.

(This post was published previously on March 7, on The Post & Email blog.)

Next: Measles Rampant Again, Thanks to Anti-Vaccinationists